|
Overview of DoSurvive
Browse Database Explore Combined Effects Analyze your data Statistics Analysis About |
DoSurvival is a webserver and a database for survival analysis, DoSurvive provides three
survival analysis method: the
log-rank test
, the
cox proportioanl hazard model
and the
accelerated failure-time model
; and four survival types: overall survival, progression-free survival,
disease-free survival and disease-specific survival. For all three methods and four survival types,
DoSurvive offers five different quantiative features, namely expression level of protein, mRNA,
miRNA, lncRNA and the methylation levels of CpG sites, for up to 33 cancer types in TCGA.
With DoSurvive, users can:
.png)
Select a Cancer & a Gene
A user who is interested in a specific cancer and a specific target feature can mouseover "Browse Database" and
then go to "Select Cancer & Gene" to browse the database.
Step 1. Select a molecular type of interest from the list (red box shown below).  Step 2. Choose the cancer type of interest from the dropdown list. *There will be different lists of cancers depending on the molecular type chosen in Step 1.  Step 3. Enter a gene name and click "Browse" to obtain the survival analysis results. Both the original p-values and adjusted p-values (BH corrected) will be listed. 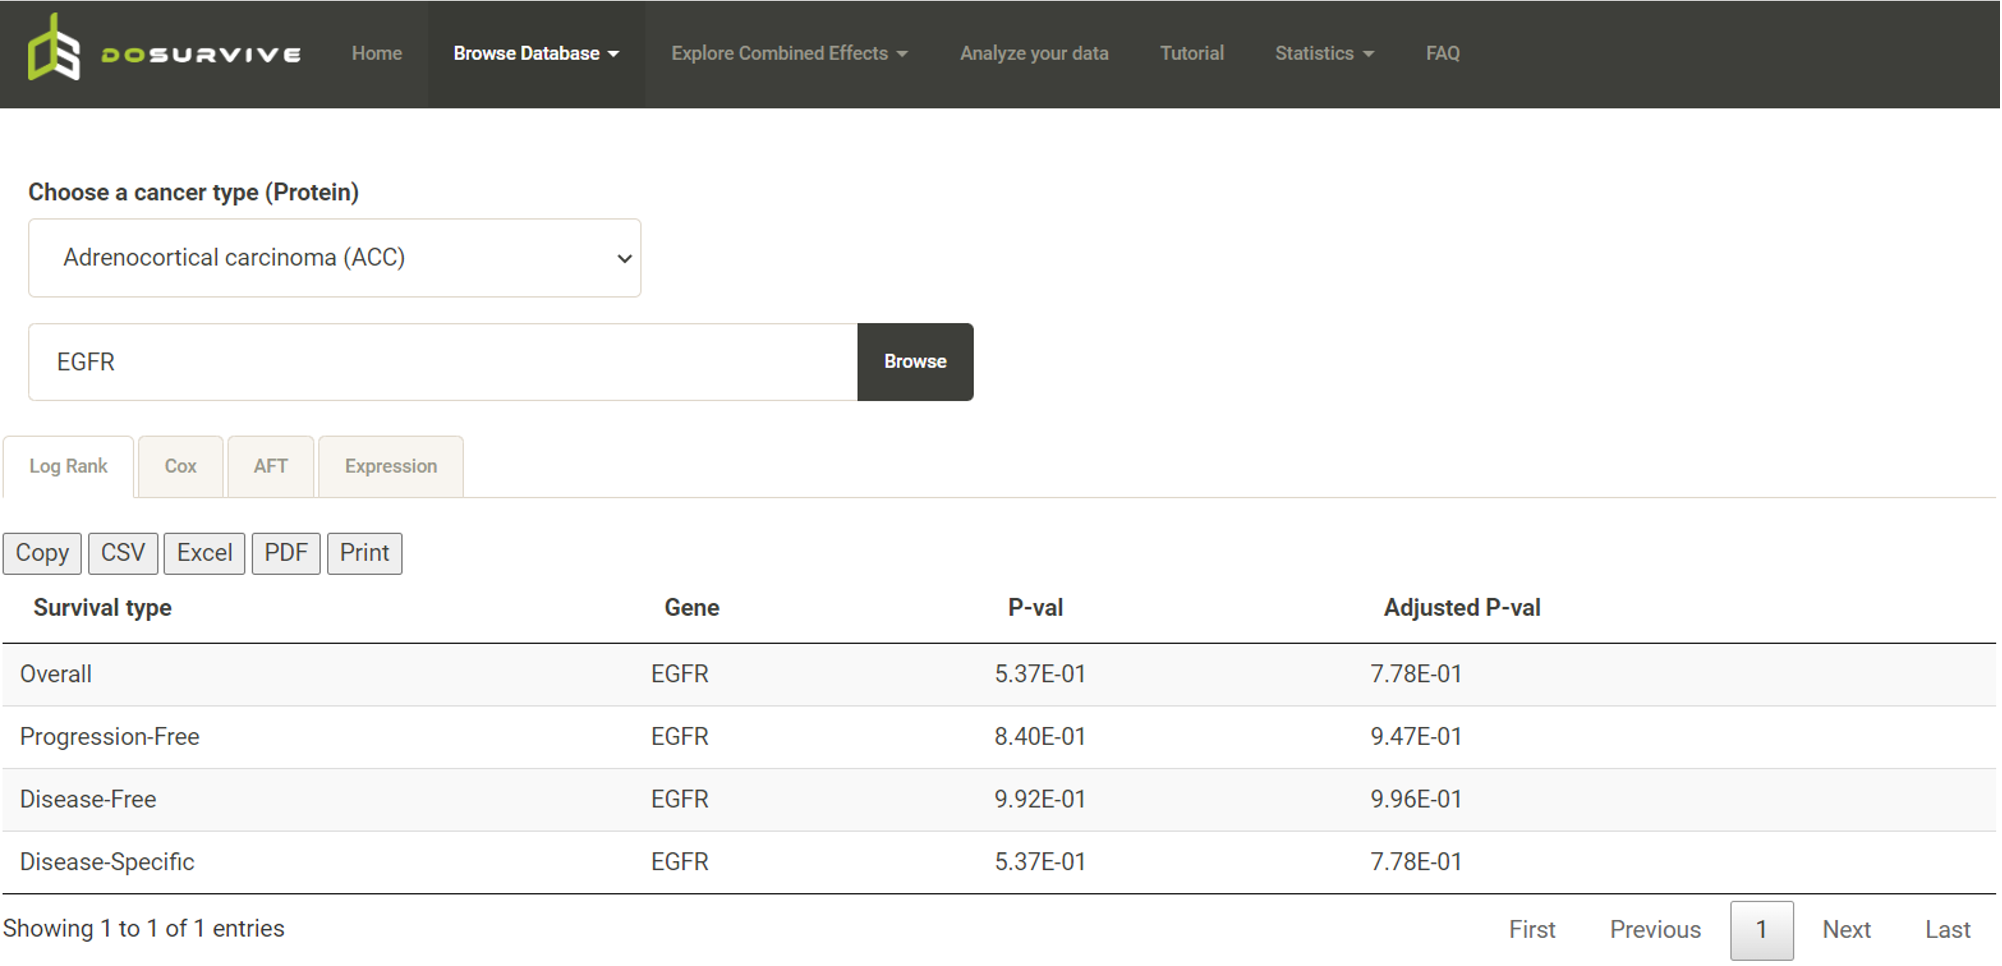 Step 4. Choose a statistical method to explore the result. The user can click the survival mode of interest and the corresponding plots or tables will be generated. For example, if the user selects "Cox" and clicks "Progression-Free" (blue box) a hazard ratio plot and a table of detailed numbers will be shown (red box). If the user selects "Log Rank", an interactive Kaplan-Meier plot will be shown (red box). *The user can customize the color/thickness of the lines in the Kaplan-Meier plot. For more detail, see Log-Rank test. 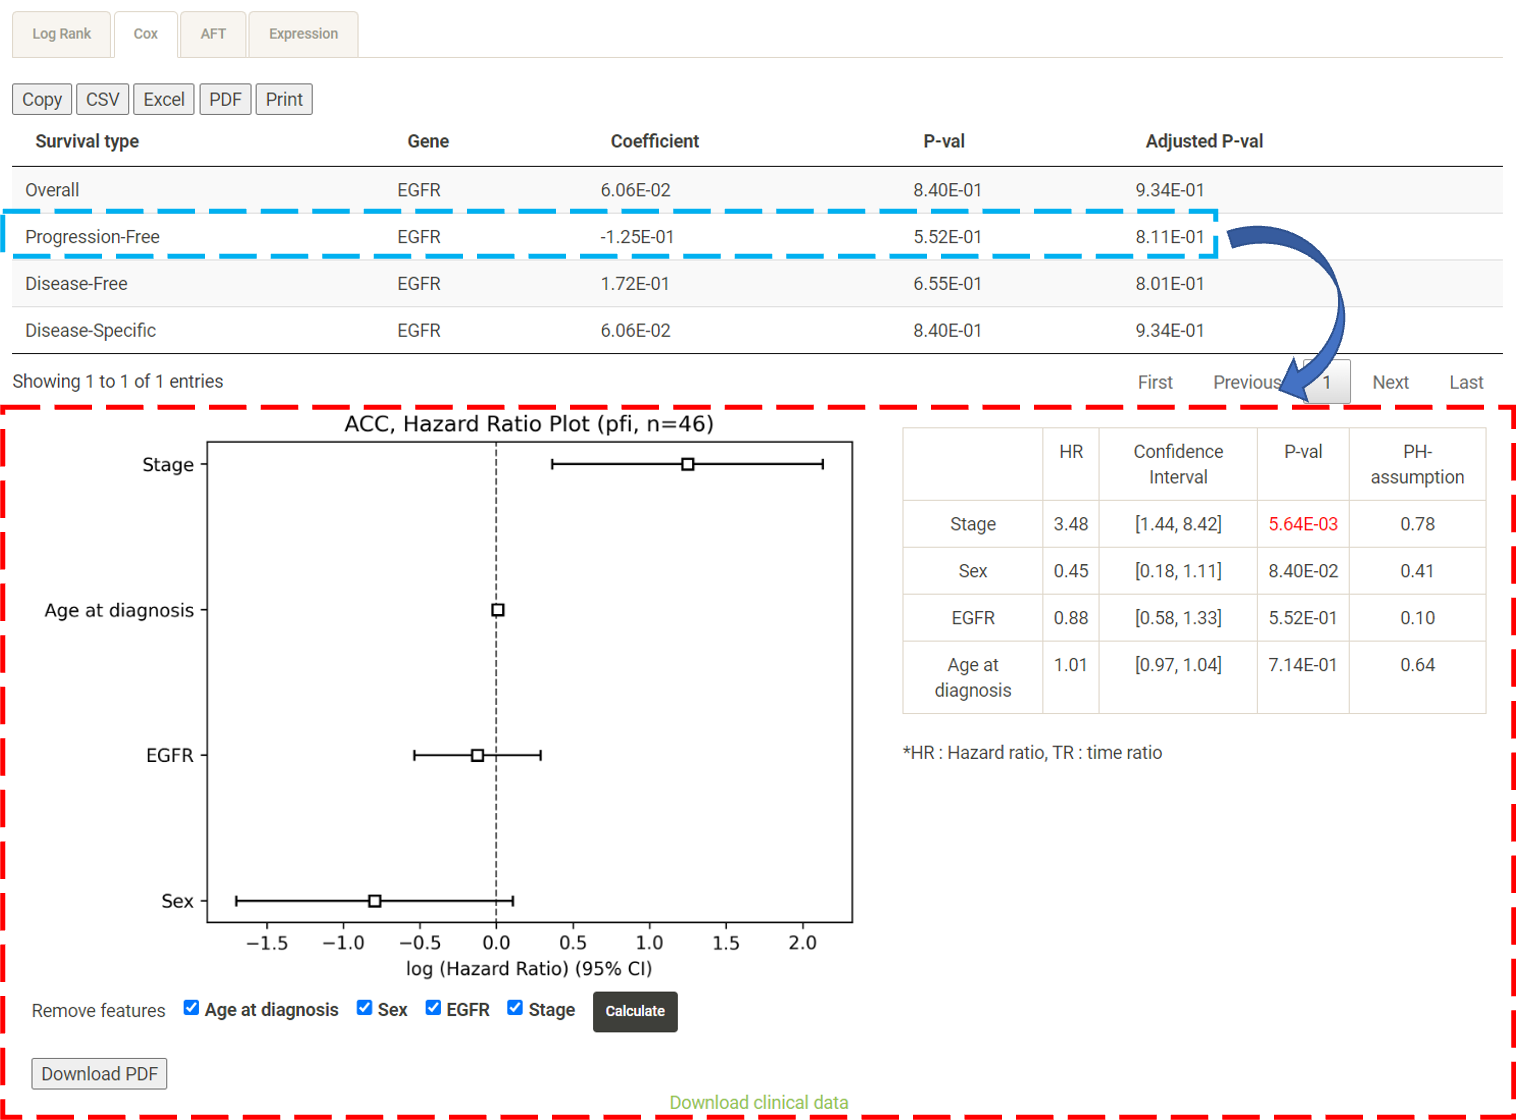 Step 5. (optional) The user may remove feature(s) from the Cox regression or AFT model by unchecking the feature(s) and clicking "calculate". For example, after unchecking "Sex" and clicking "calculate", the results from the new Cox regression model are calculated on the fly, with output as follows: 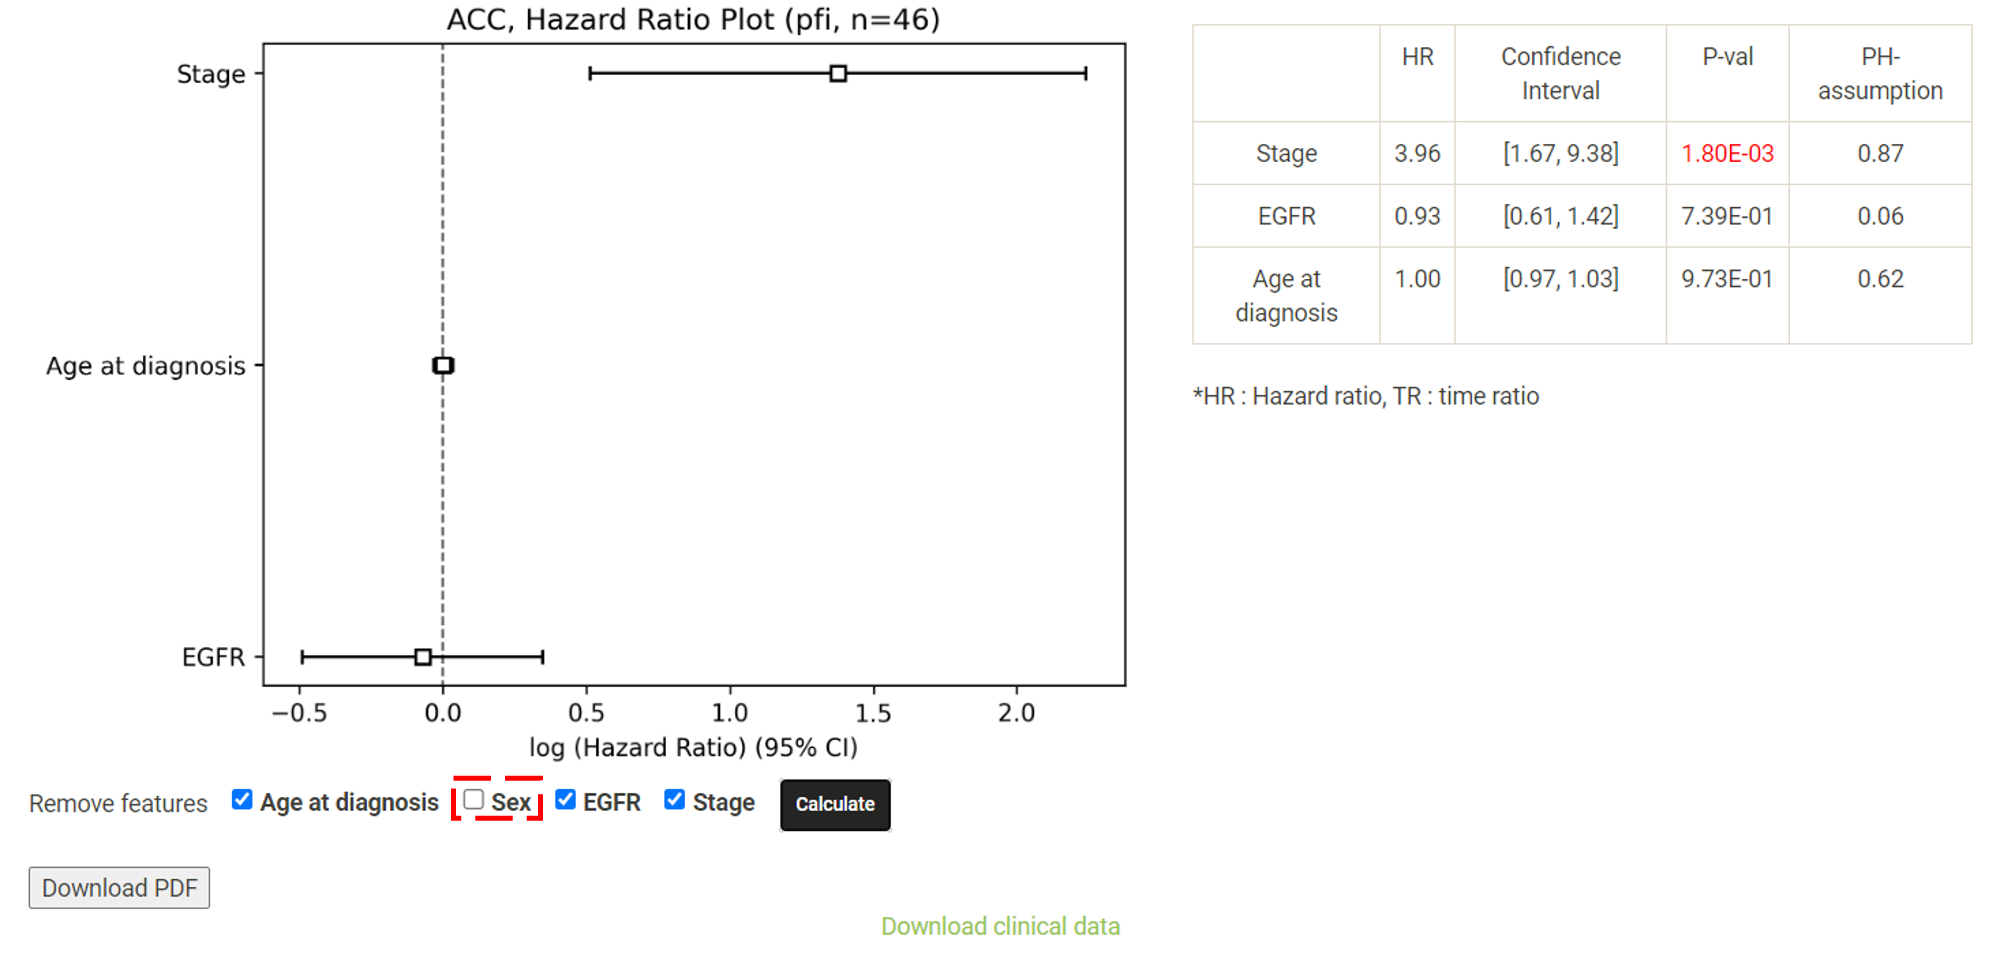 Step 6. (optional) For mRNA, the user can further explore the correlation between a specific mRNA gene and its upstream CpG sites. By clicking the button labeled 450k or 27k, a pop-up window will show all the upstream CpG sites for the specified mRNA. The user can explore the survival analysis results or the beta values for this particular CpG site across different cancer types. For more details, see mRNA & methylation. 
Select a Cancer
A user who is interested in a specific cancer can mouseover "Browse Database" and then
go to "Select Cancer" to browse the database.
Step 1. Select a molecular type of interest from the list (red box shown below).  Step 2. Choose the cacner type of interest from the dropdown list and click "Browse". *There will be different lists of cancers depending on the molecular type chosen in Step 1. 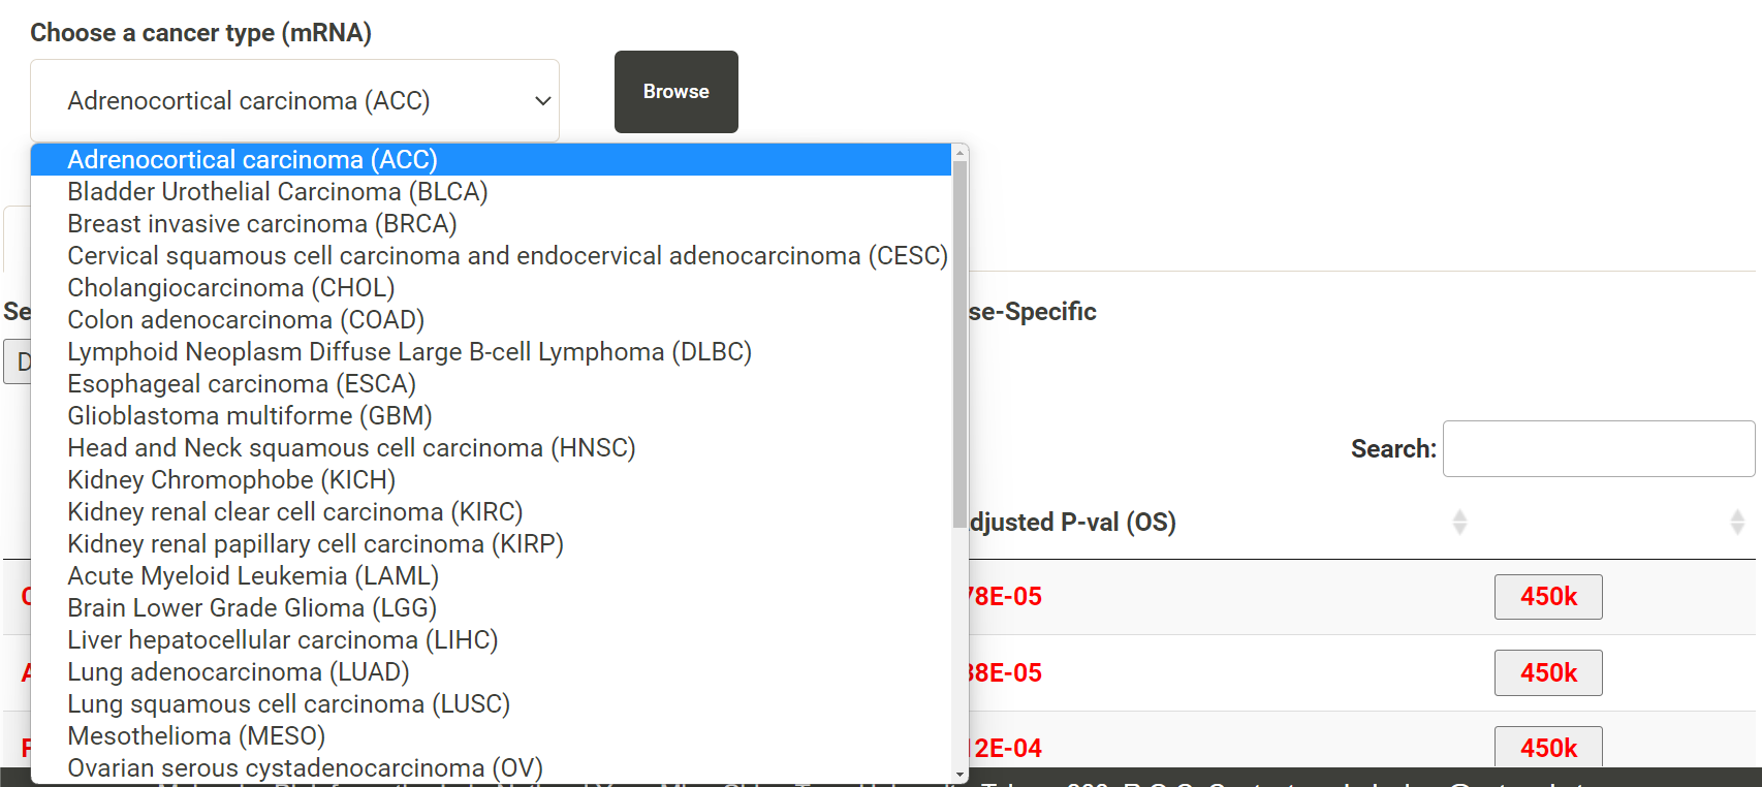 Step 3. Choose a statistical method to explore the results. All the features for the selected molecular type for the selected cancer will be shown and ranked by their adjusted p-value (BH corrected) in a table. Significant risks and protective features will be shown in red and green, respectively.  Step 4. The user can click the feature (gene) of interest and the corresponding plot or table will be generated below the table. For example, if the user selects "Cox" and clicks a specific gene (blue box), a hazard ratio plot and a table with detailed numbers will be shown (red box). If the user selects "Log rank", an interactive Kaplan-Meier plot will be shown. *The user can customize for color/thickness of the lines in the Kaplan-Meier plot. For more details, see Log-rank test. 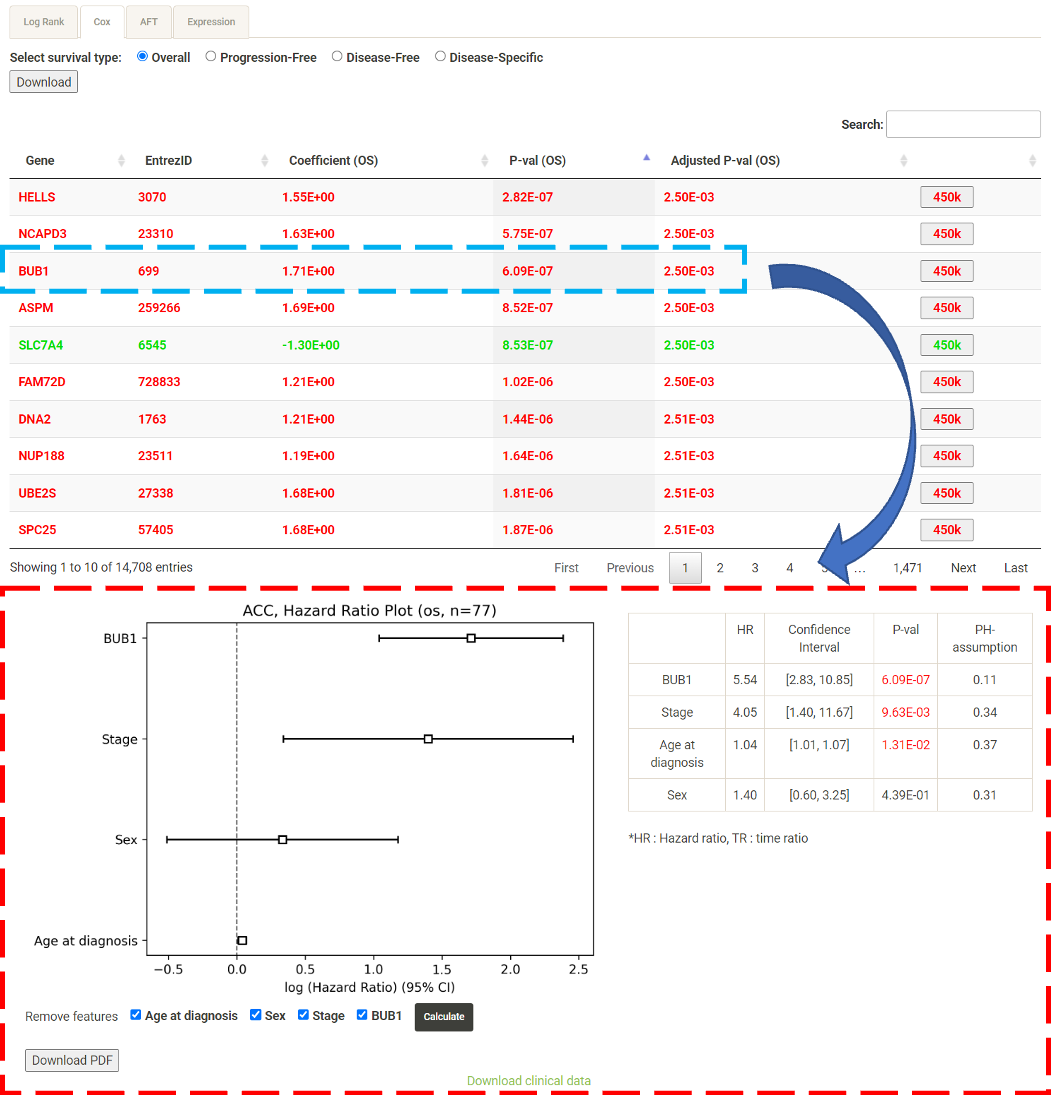 Step 5. The user can select a survival type of interest to explore (red box) and the corresponding table will be shown on the fly. 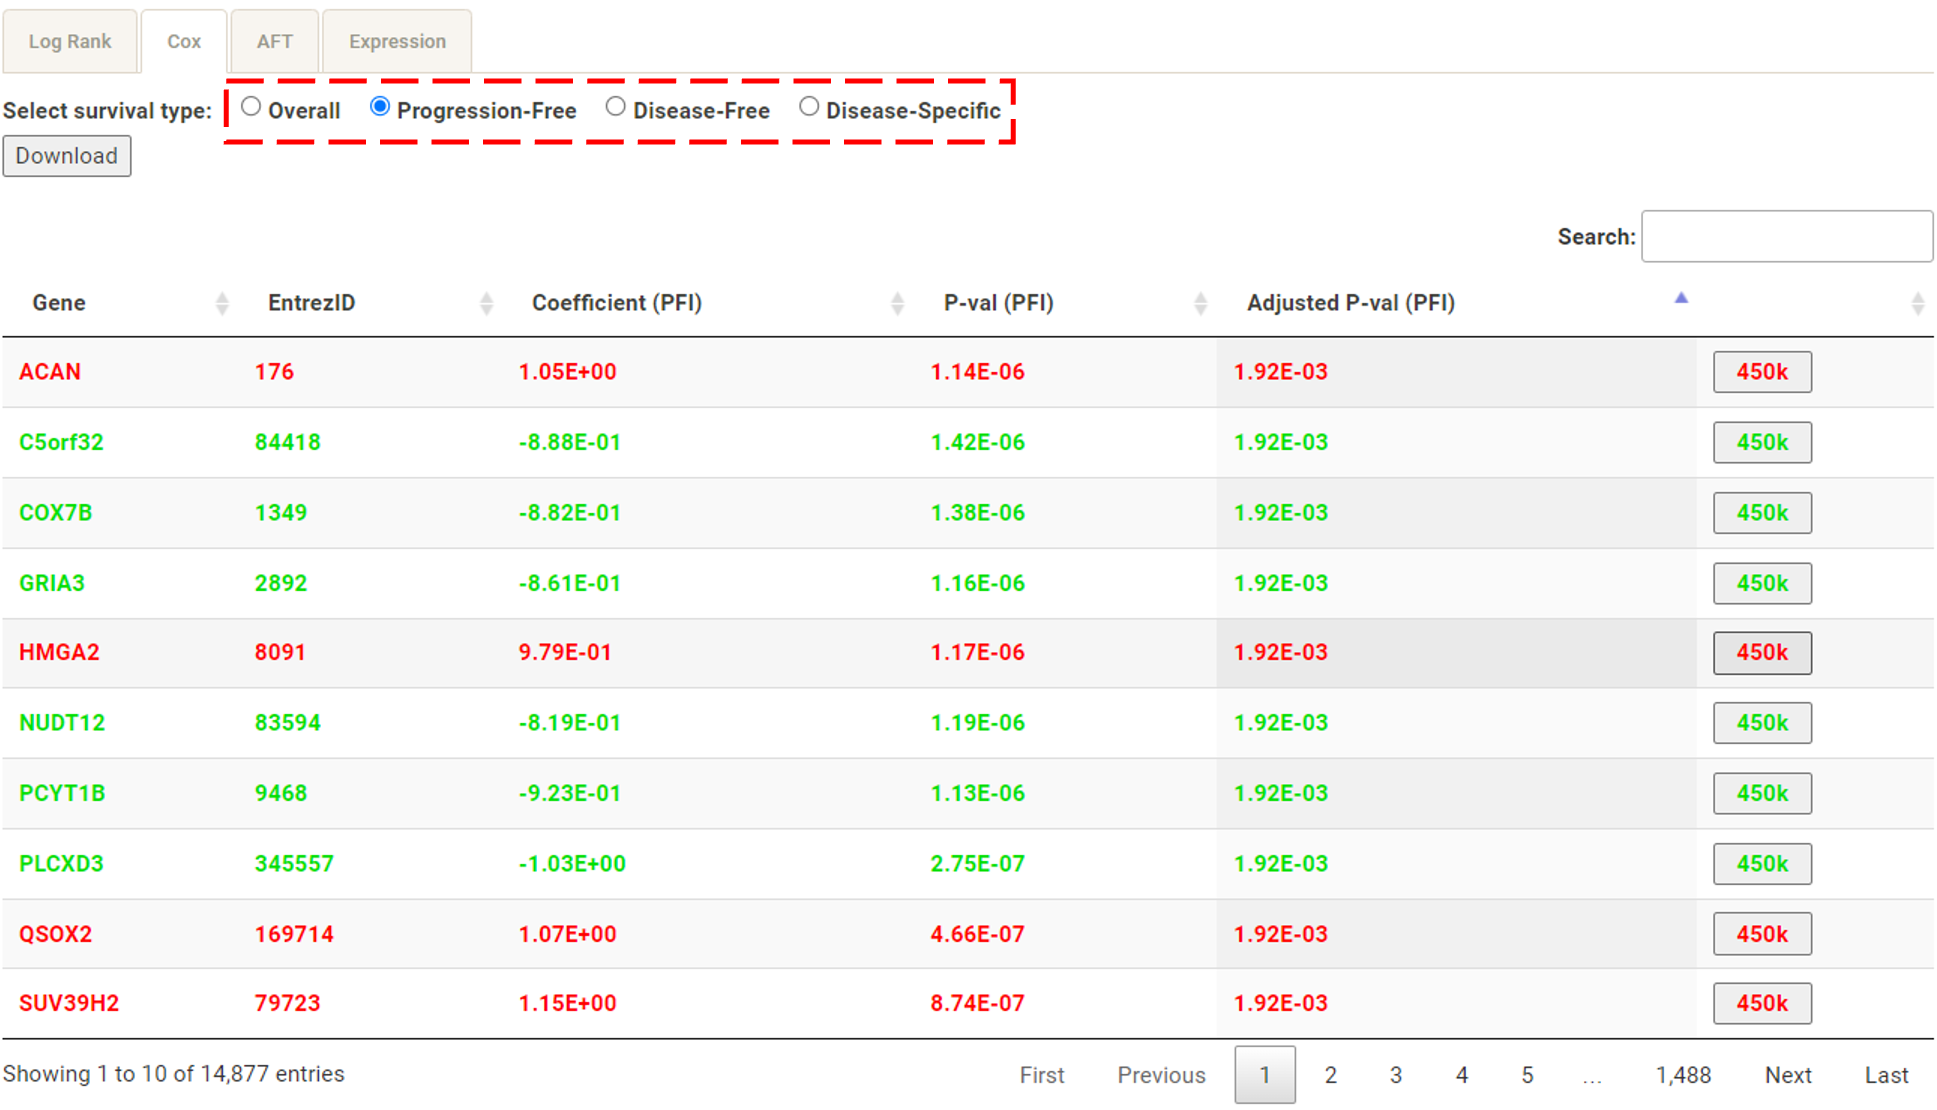 Step 6. (optional) The user may remove feature(s) from the Cox regression or AFT model by unchecking the features and clicking "calculate", the results from the new Cox regression model is calculated on the fly, as follows: 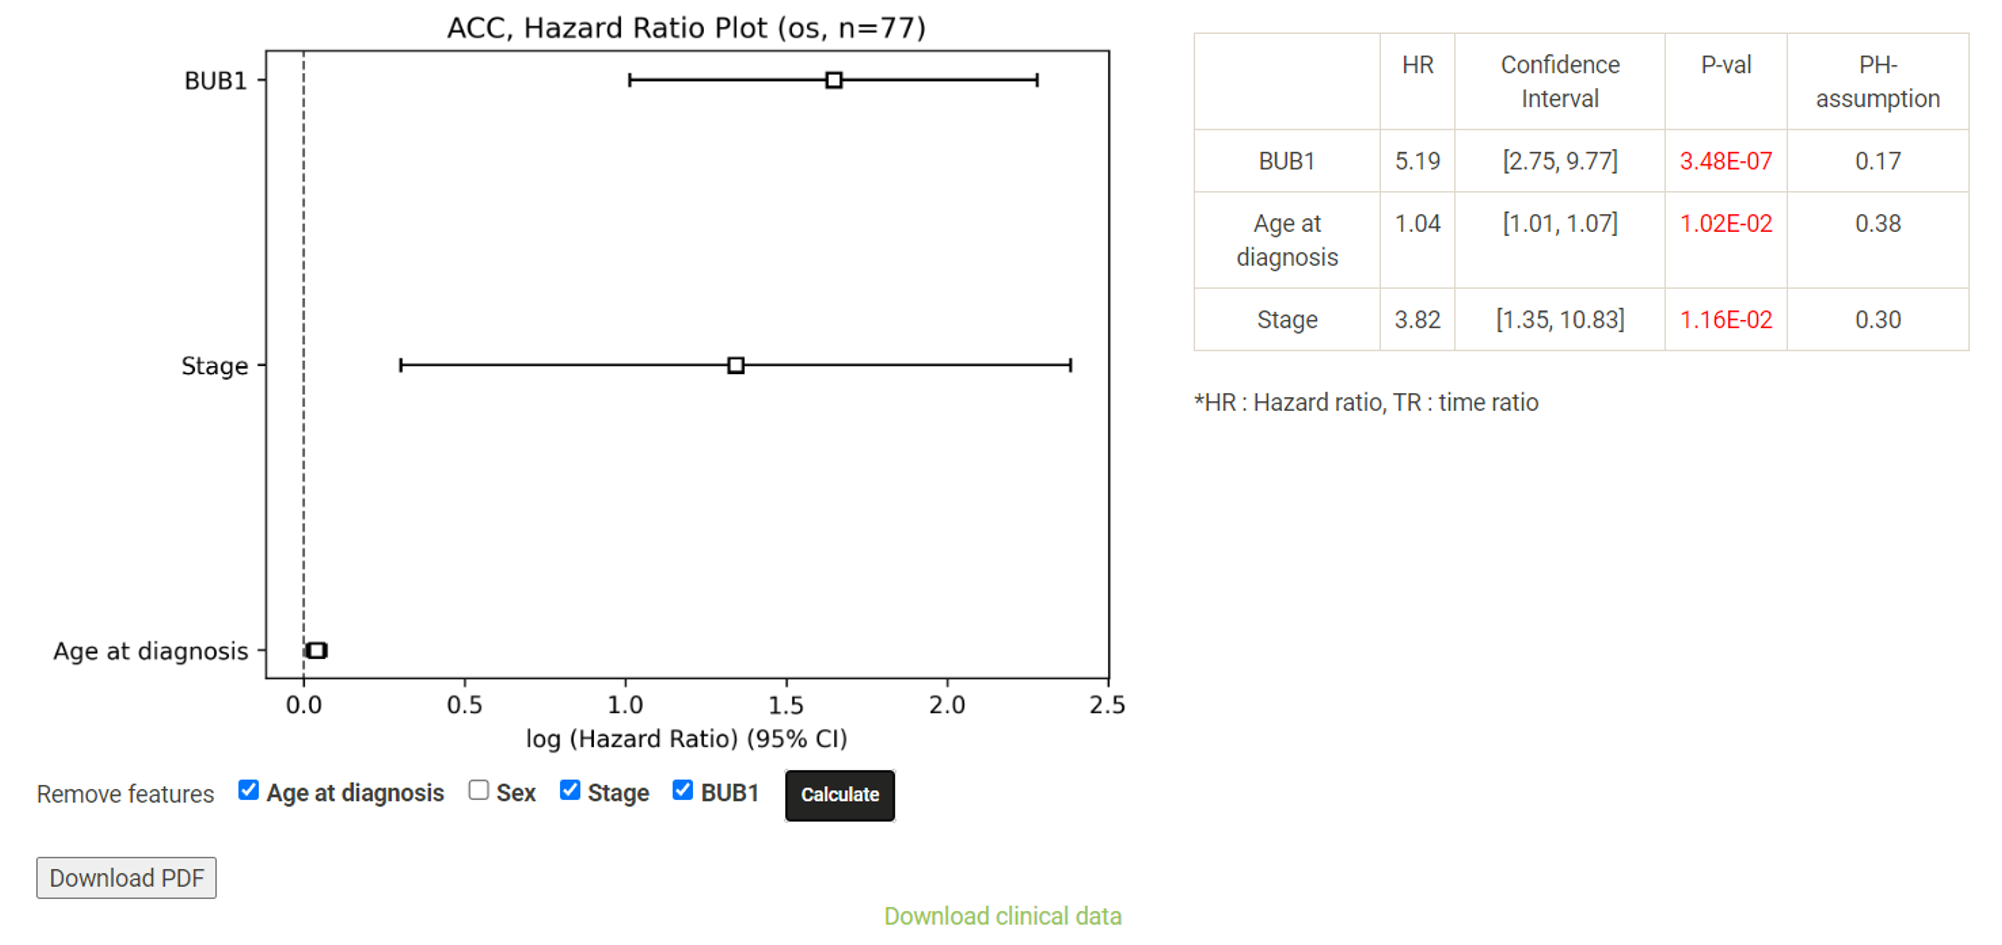 Step 7. (optional) For mRNA, the user can further explore the correlation between a specific mRNA gene and its upstream CpG sites. By clicking the button labeled 450k or 27k, a pop-up window will show all the upstream CpG sites for the specified mRNA. For more details, see mRNA & methylation. 
Select a Gene
The user who is interested in specific gene can mouseover "Browse Database" and then go to "Select Gene" to browse the database.
Step 1. Select "Select Gene" (red box below).  Step 2 . Choose the cancer type of interest form the dropdown list and click "Browse". 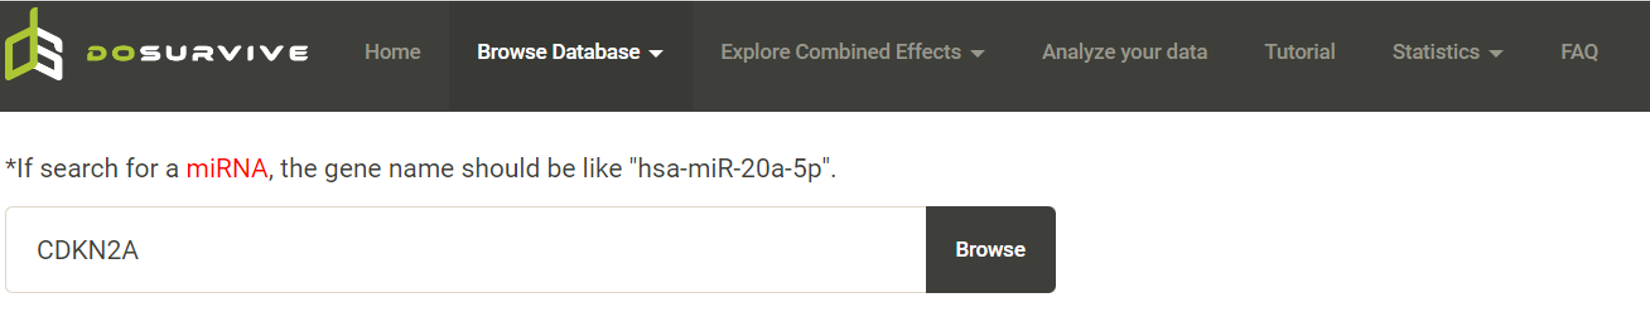 Step 3. Choose a Statistical method from the dropdown list to explore the results. The survival analysis results for the queried gene across all cancer types will be displayed in a table and ranked by their adjusted p-values (BH corrected) in a table. Significant risk and protective features will be shown in red and green, respectively. *When methylation27k and methylation450k are loading, you are free to operate the current webpage. 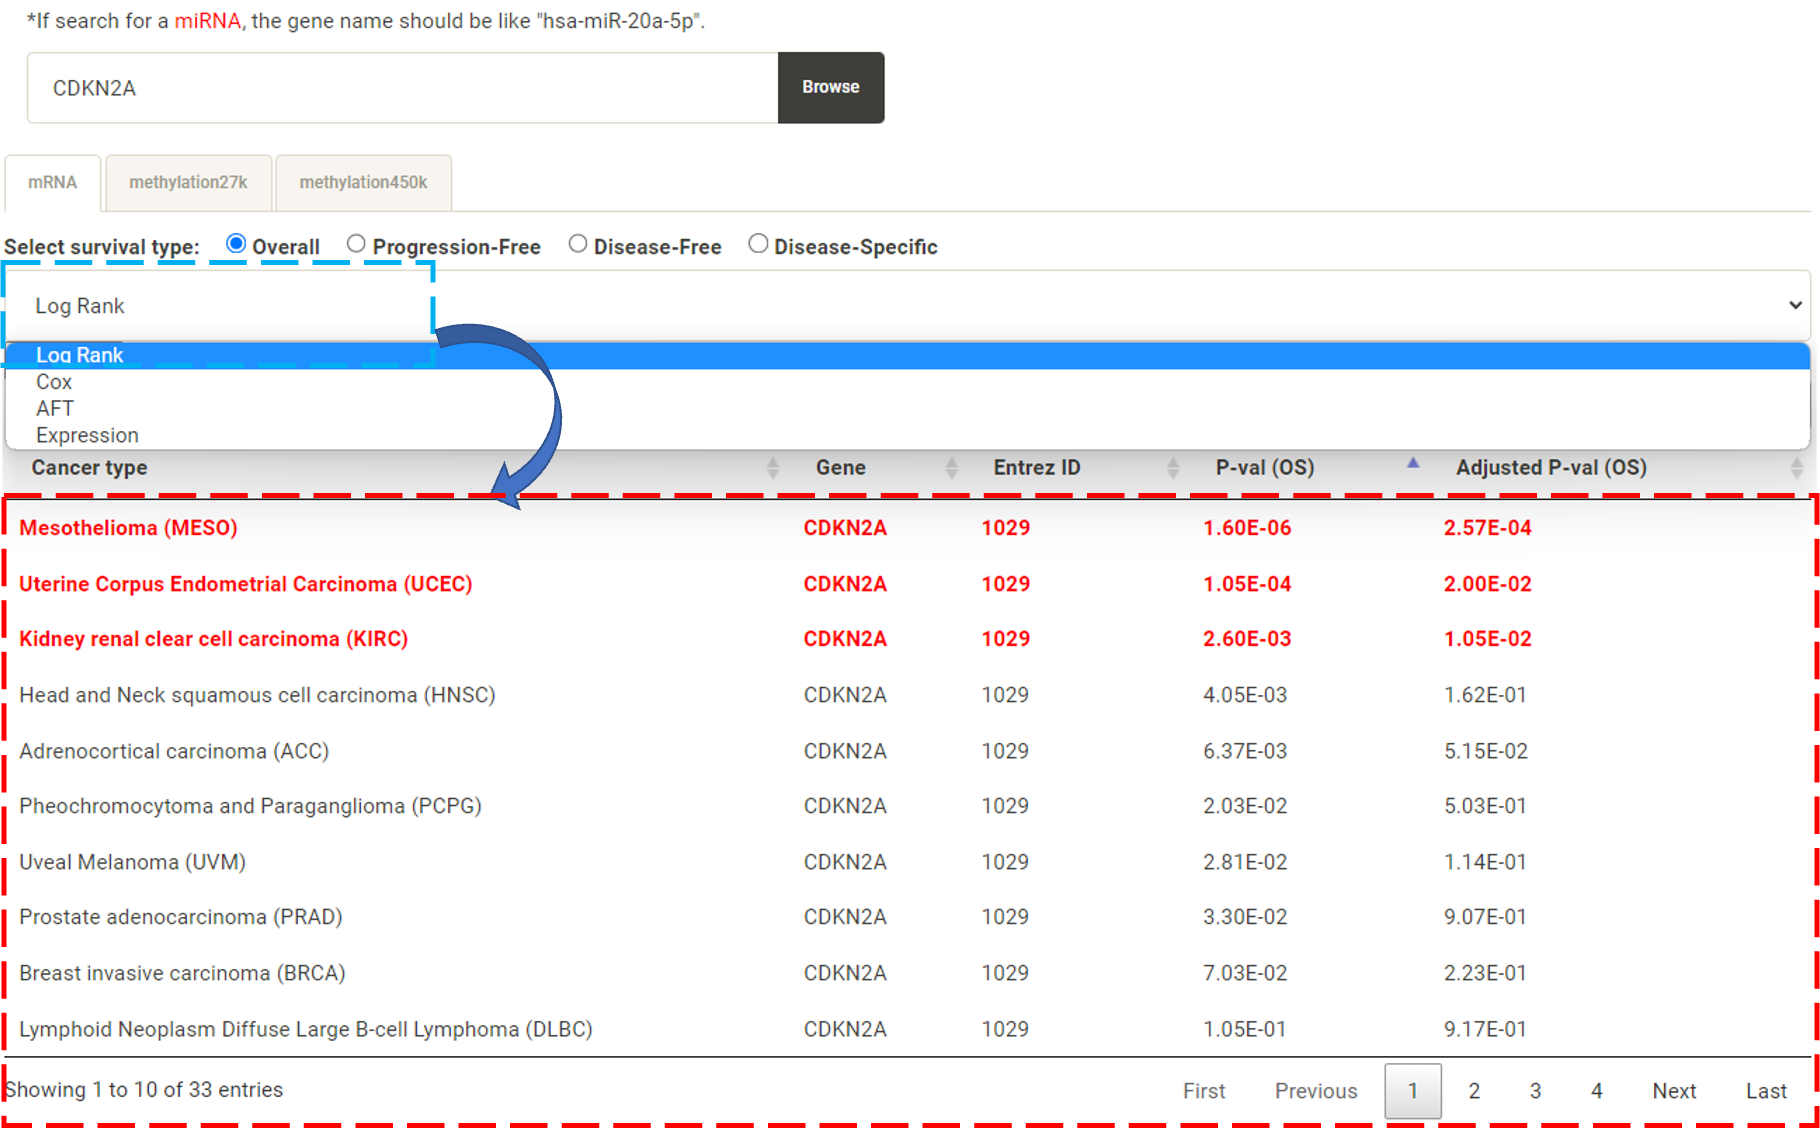 Step 4. The user can click the feature (gene) of interest and the corresponding plot or table will be generated below the table. For example, if the user selects "Log Rank" and clicks Mesothelioma (MESO) (blue box) an interactive Kaplan-Meier plot will be shown (red box). *The user can customize the color/thickness of the lines and the follow up threshold or values used to split patients in the Kaplan-Meier plot. See Log-rank test for more details. 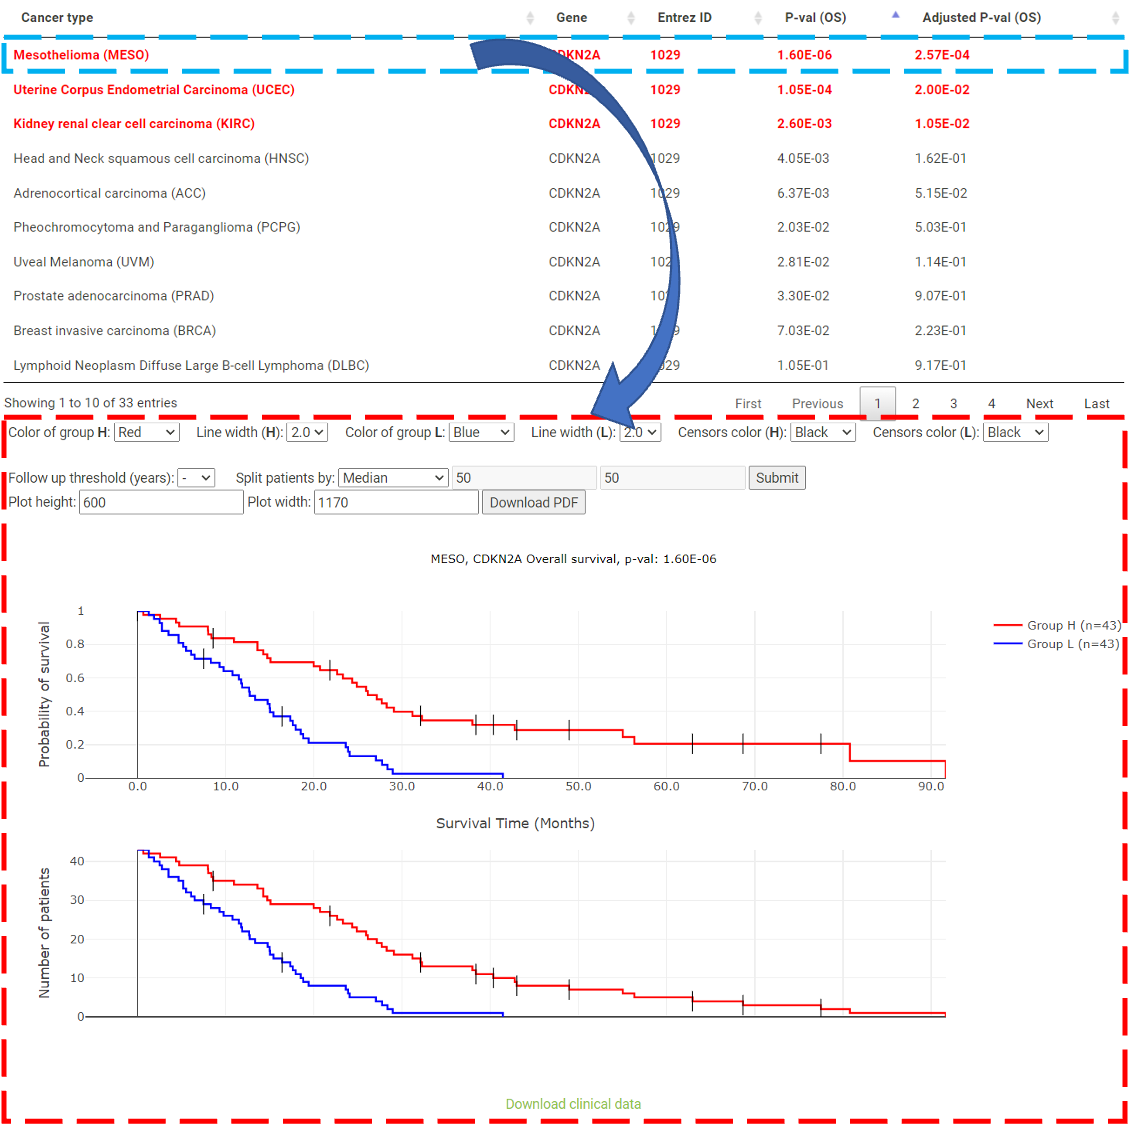 Step 5. The user can select a survival type of interest to explore (red box) and the corresponding table will be shown on the fly. 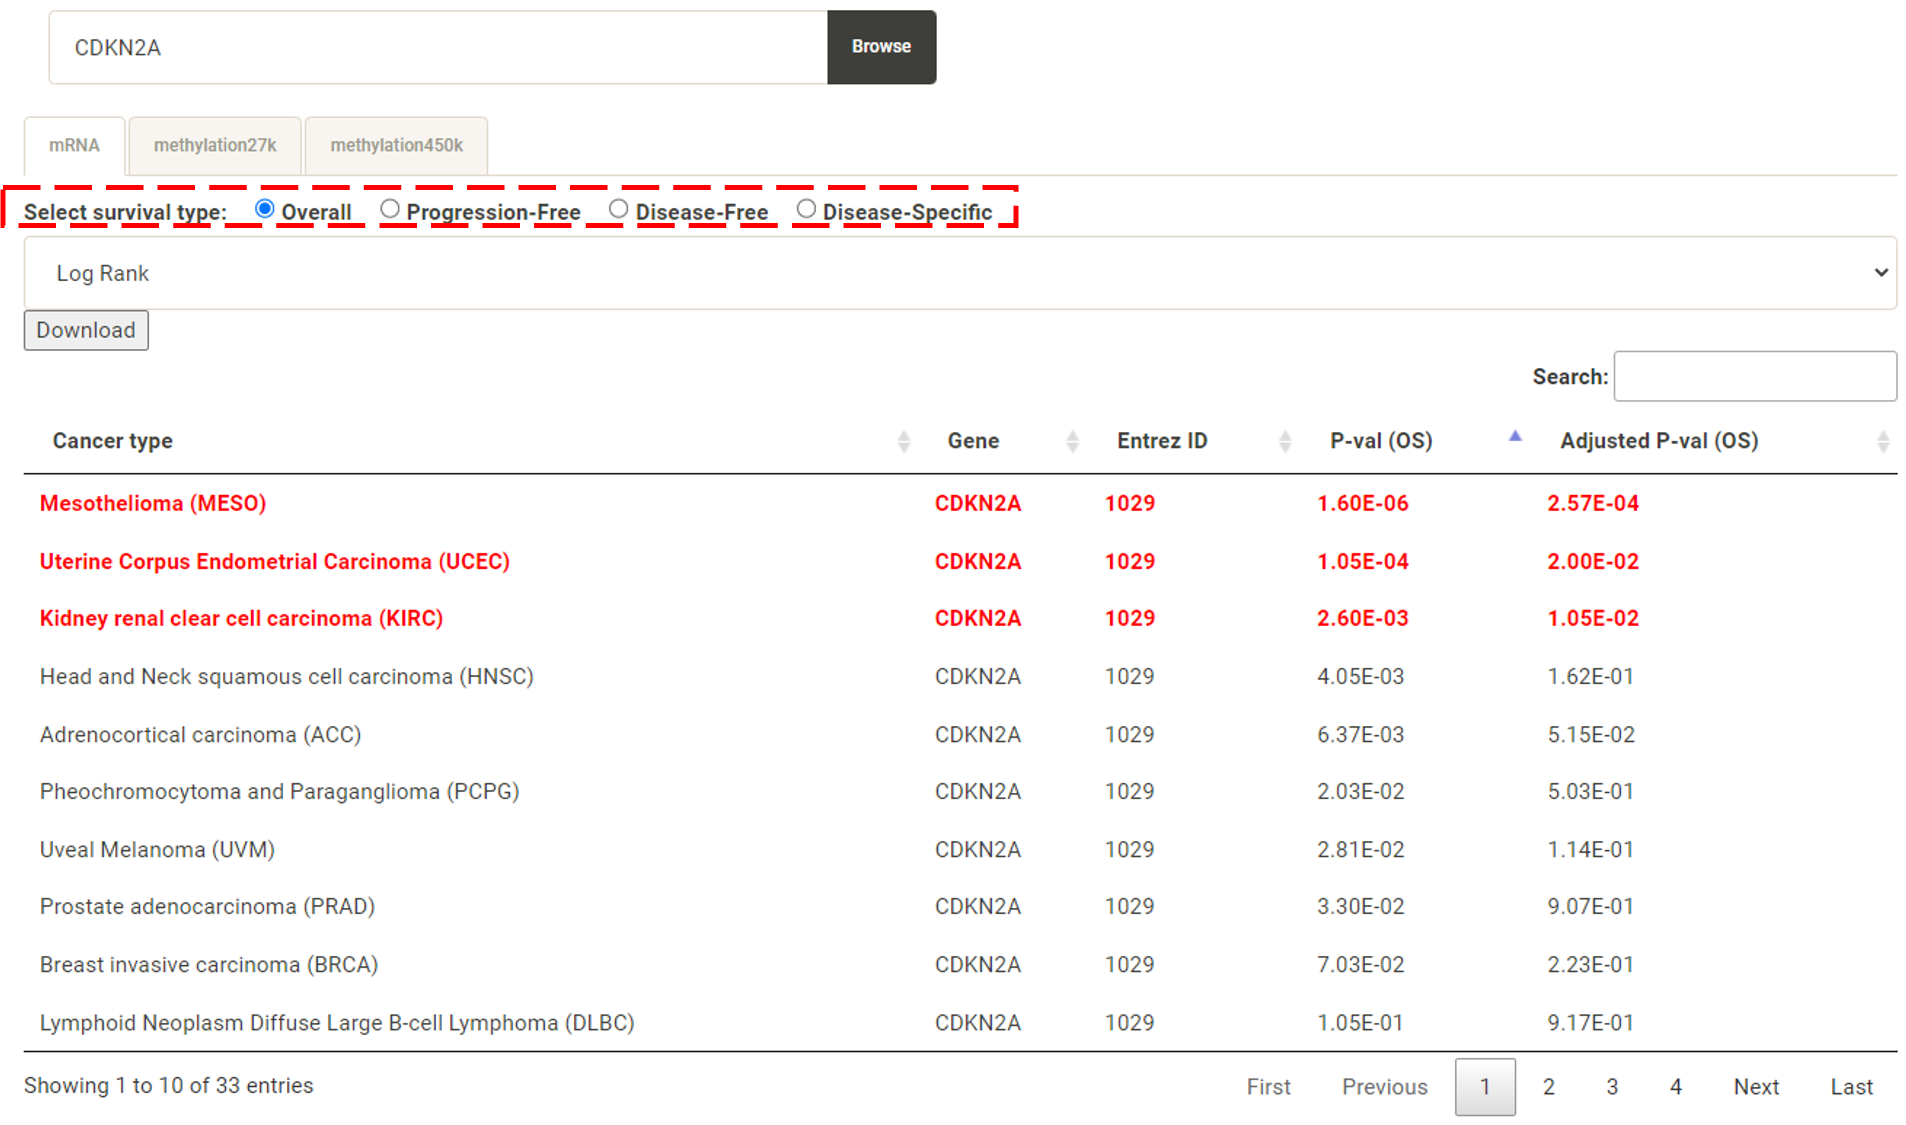 Step 6. (optional) The user may remove feature(s) from the Cox regression or AFT model by unchecking the feature(s) and clicking "calculate" (blue box). In the following example, after unchecking "Stage" and clicking "calculate" (which violates PH assumption), the results from the new Cox regression model are calculated on the fly. 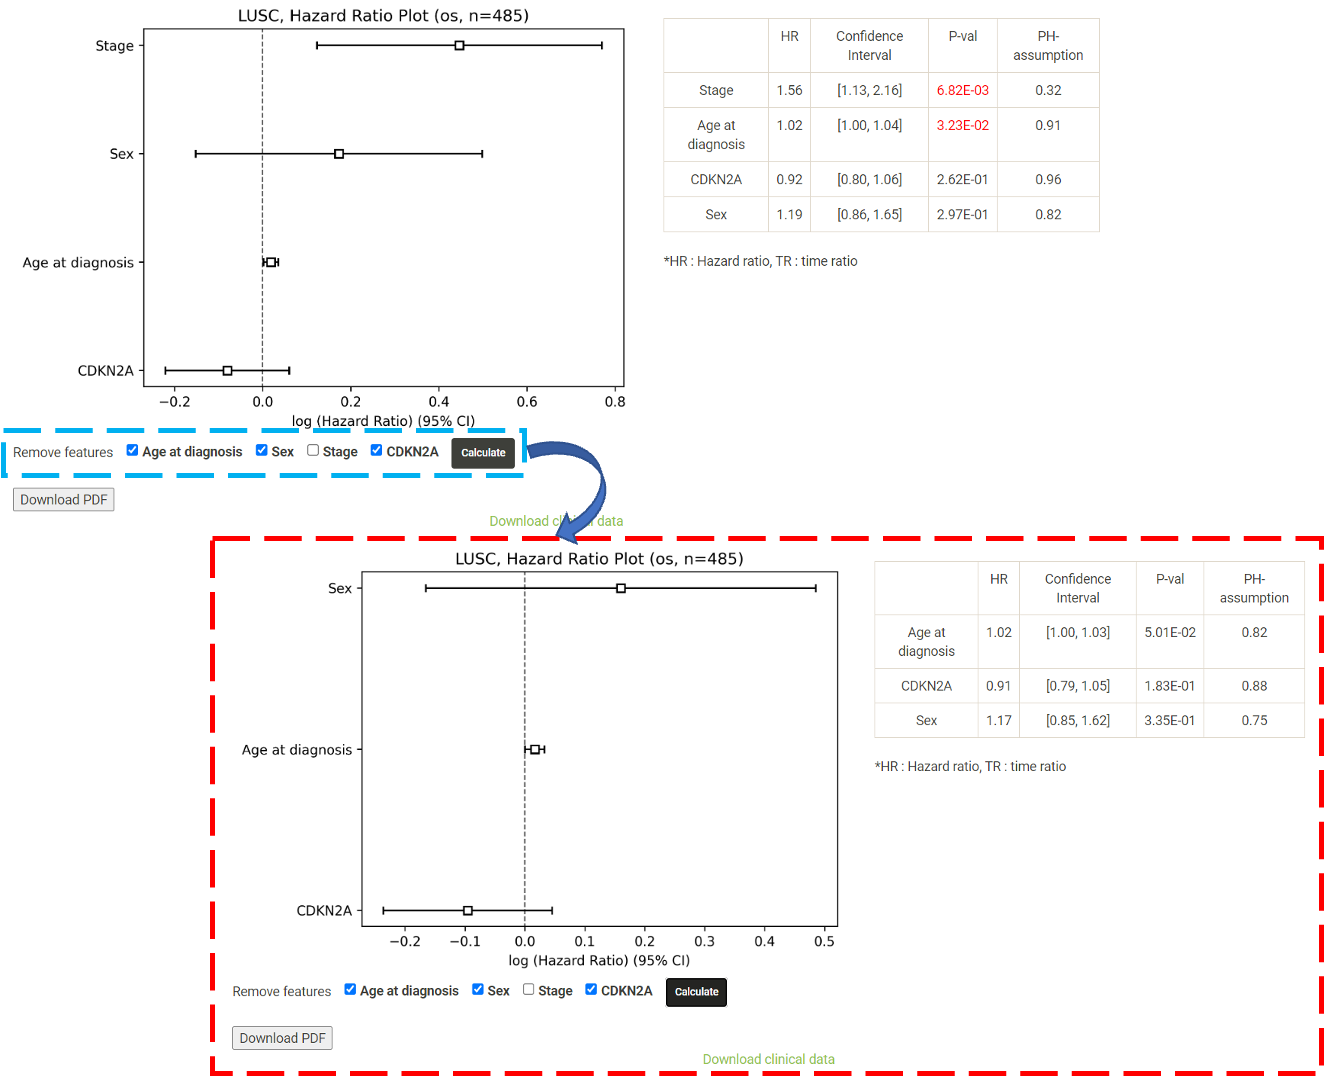 Step 7. (optional) For mRNA, the user can further explore the correlation between a specific mRNA gene and its upstream CpG sites. By clicking the button labeled 450k or 27k, a pop-up window will show all the upstream CpG sites for the specified mRNA. For more details, see mRNA & methylation. 
Explore Methylation Level & Survival
The user who is interested in the methylation levels of CpG sites can explore the survival analysis
results for CpG sites by querying their downstream genes.
Step 1. Go to the table of the survival analysis results for the gene of interest and click button labeled 450k or 27k. A pop-up window will show the survival analysis results for all the upstream CpG sites for the gene of interest. 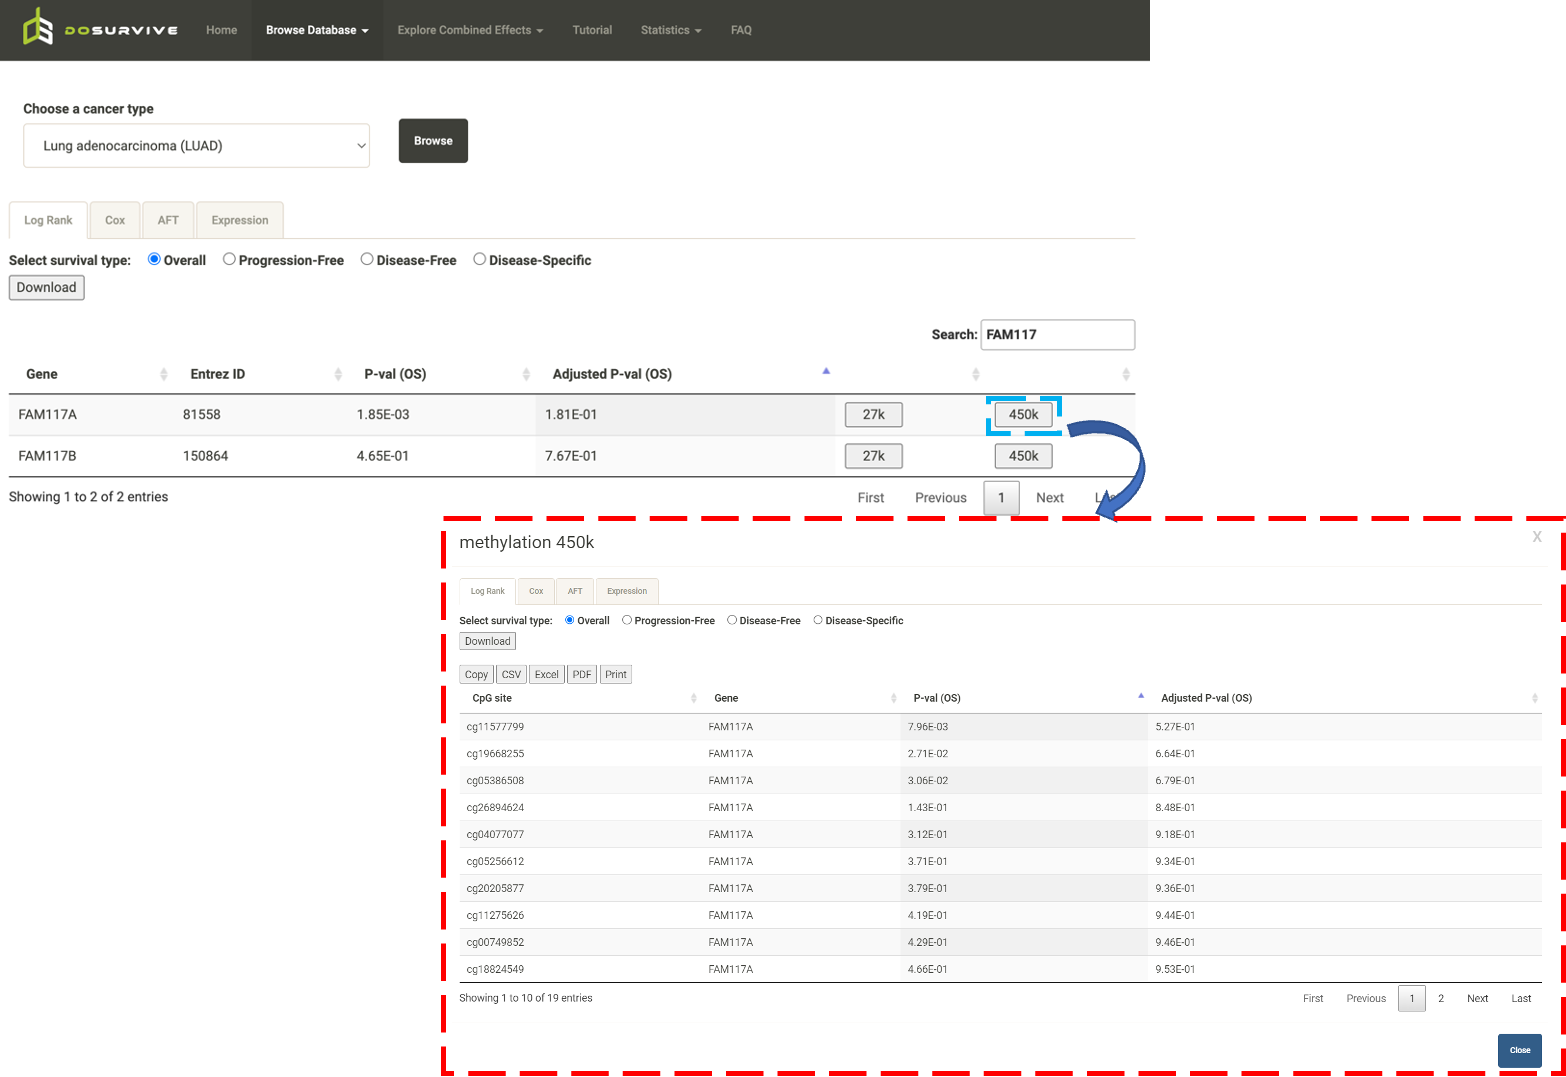 Step 2. Choose a statistical method from the dropdown list to explore the results. The survival analysis results for the queried gene in all the cancer types will be shown and ranked by their adjusted p-valuee (BH corrected) in a table. Significant risks and protective features will be shown in red and green, respectively.  Step 3. The user can click the CpG site of interest and the corresponding plot or table will be generated below the table. For example, if the user selects "Log Rank" and selects a CpG site (blue box), an interactive Kaplan-Meier plot will be shown (red box). *The user can customize the color/thickness of the lines in the Kaplan-Meier plot. For more details, see Log-Rank test.  Stpe 4. The user can select a survival type of interest (red box) and the corresponding table will be shown on the fly. 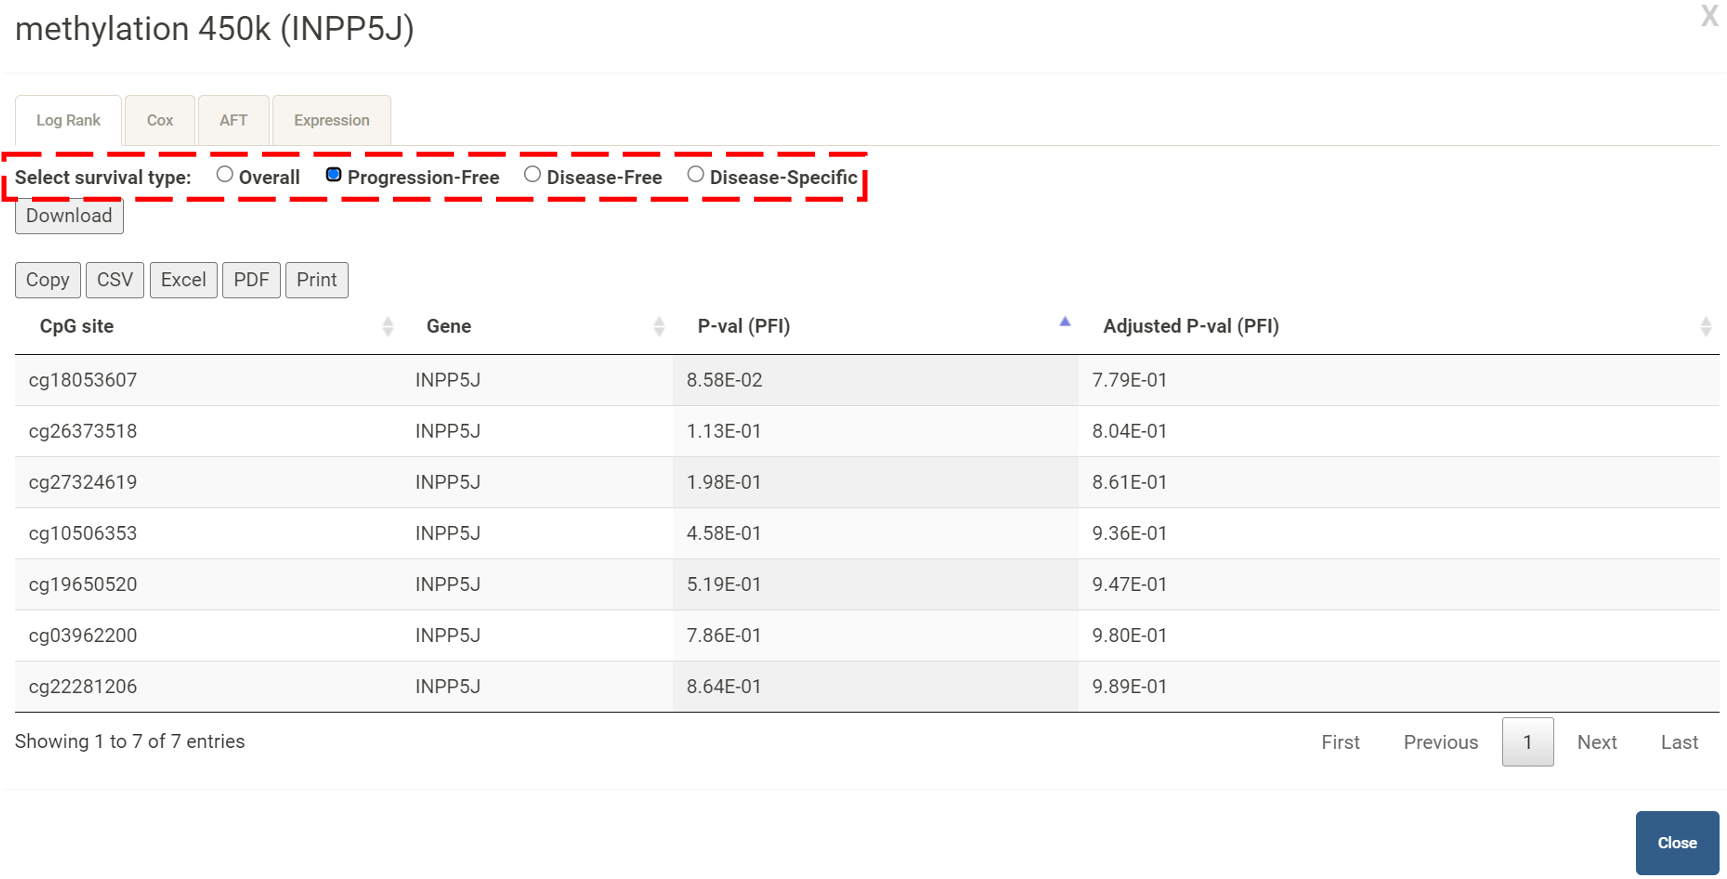 Step 5. (optional) The user may remove feature(s) from the Cox regression or AFT model by unchecking the feature(s) and clicking "calculate", which violates the PH assumption, the results from the new Cox regression model are calculated on the fly. 
Two Genes
A user who is interested in the combined effect of two genes in survival, can mouseover "Explore
Combined Effects" and then go to "Two genes" to analyze the combined effect with the log rank test, the
cox proportional hazard or the accelerated failure-time (AFT) model.
Step 1. Select a combination of two genes from the list (red box shown below). 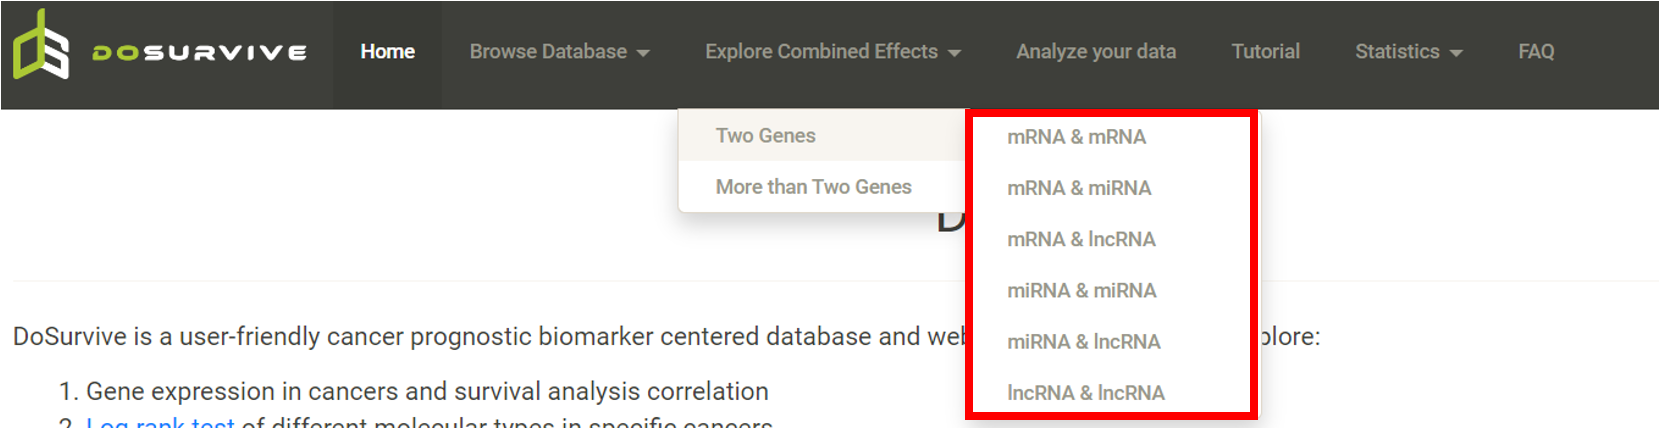 Step 2. Choose the cancer type of interest from the dropdown list.  Step 3. Enter two genes in the two text boxes (blue box) and select the groups (green box) that are to be compared using log-rank test. Click "calculate".  Step 4. Choose a statistical method to explore the results. The user click the survival type of interest and the corresponding plot or table will be generated. For example, if the user selects "Log Rank" and clicks "Progression-Free" (blue box), an interactive Kaplan-Meier will be shown (red box). If the user selects "Cox" and click "Progression-Free", a hazard ratio plot and a table with detailed numbers will be shown. *The user can customize the color/thickness of the lines in the Kaplan-Meier plot. For more details, see Log-Rank test.  Step 5. (optional) The user may remove feature(s) from the Cox regression or AFT model by unchecking the feature(s) and clicking "calculate". For example, after unchecking "Sex" and clicking "calculate", the results from the new Cox regression model are calculated on the fly. 
More than Two Genes (>2 Genes)
A user who is interested in the combined effect of more than two genes on survival can mouseover
"Explore Combined Effects" and then click ">2 genes" to analyze the combined effect with
the Cox proportional hazards model and the accelerated failure-time (AFT) model.
Step 1. Select ">2 genes" (red box shown below).  Step 2. Choose the cancer type of interest from the dropdown list.  Step 3. Enter the target mRNA genes, miRNA and lncRNA, in the first, second and third text box, respectively. The entered gene will be listed directly below the text box and the user can remove the entered gene by clicking wanted features. After all the genes have been filled in, click "calculate" to implement the analysis. 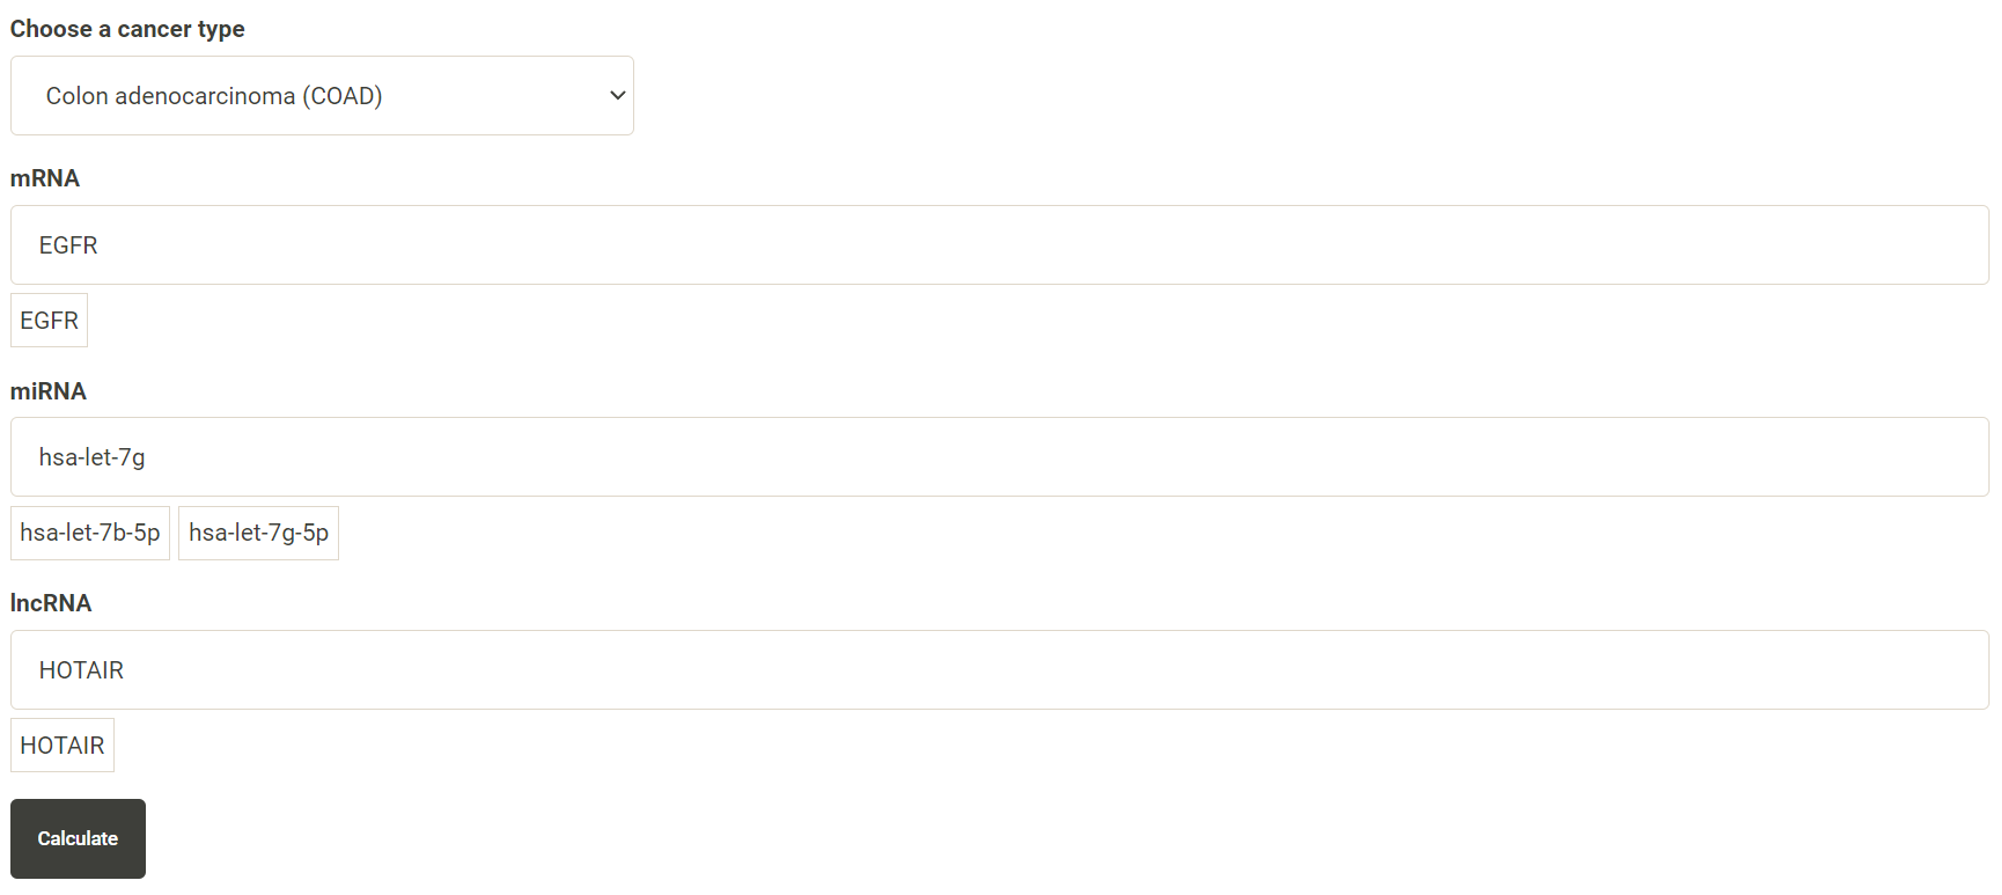 Step 4. Choose a statistical method for analysis. The user can click the survival model of interest and the corresponding plot or table will be generated. For example, if the user selects "Cox" and clicks "Progression-Free" (blue box) a hazard ratio plot and a table with detailed numbers will be shown (red box).  Step 5. (optional) The user may remove feature(s) from the Cox regression or AFT model by unchecking the feature(s) and clicking "calculate". For example, after unchecking "Sex" and clicking "calculate", the results from the new Cox regression model are calculated on the fly. 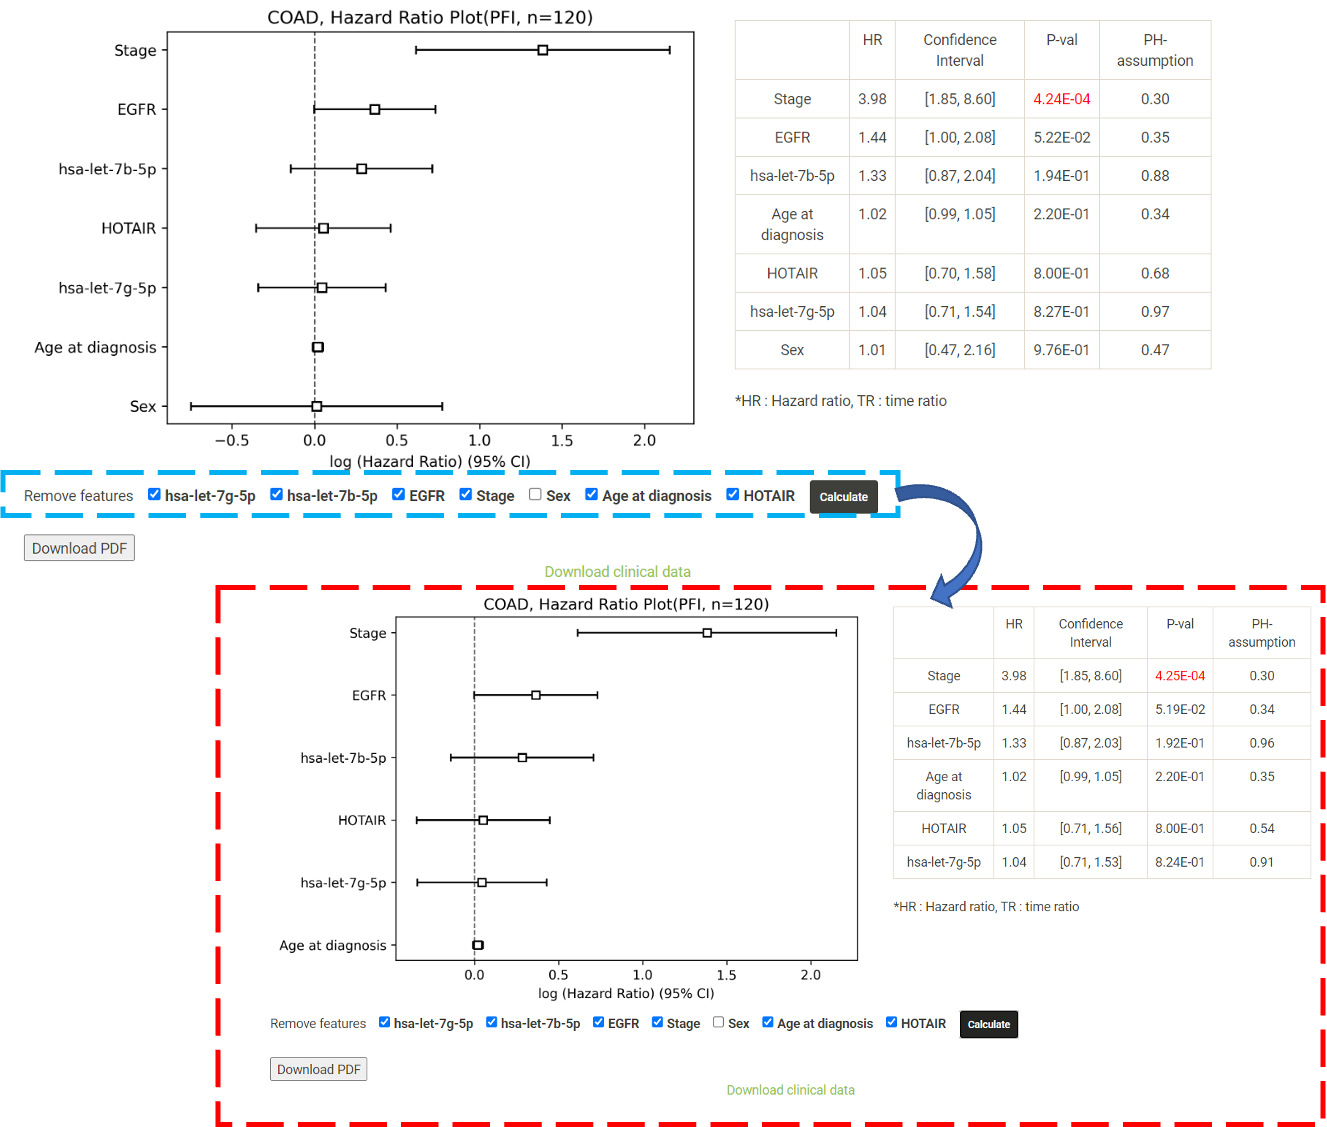
Analyze your data
A User interested in running a log-rank test, Cox regression or AFT model on their own dataset can click on 'Analyze your data'.
 Step 1. Click "Choose file" and select a file and then click "Load" to upload the file. * The uploaded data must have two columns, survival days and survival status, for survival analysis. Users who are unsure about the file format can download the demo data by clicking on "Download demo data" 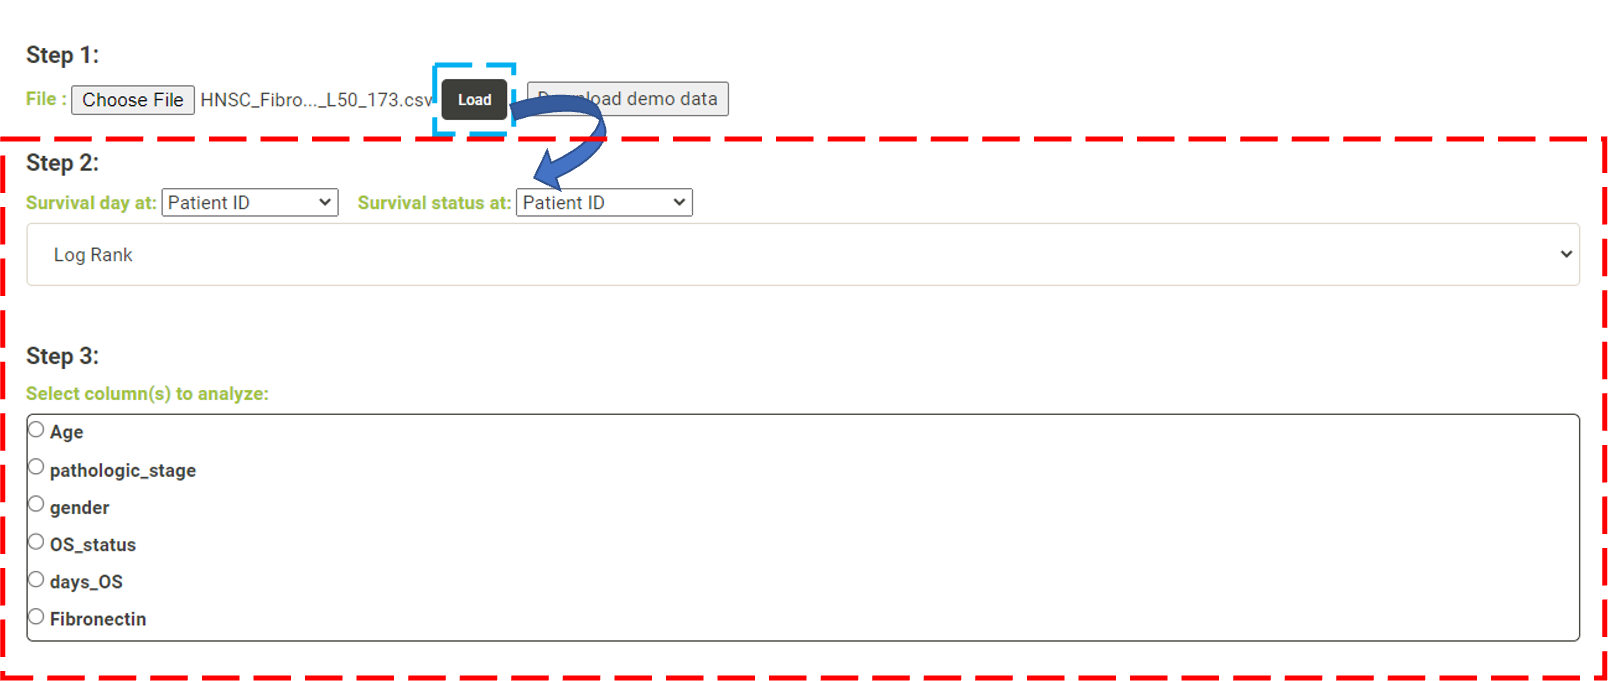 Step 2. From these dropdown lists, the user needs to select one column as survival day (number of days) and another column as survival status, respectively. The user needs then choose whether to perform a log-rank test, Cox regression or AFT for survival analysis.  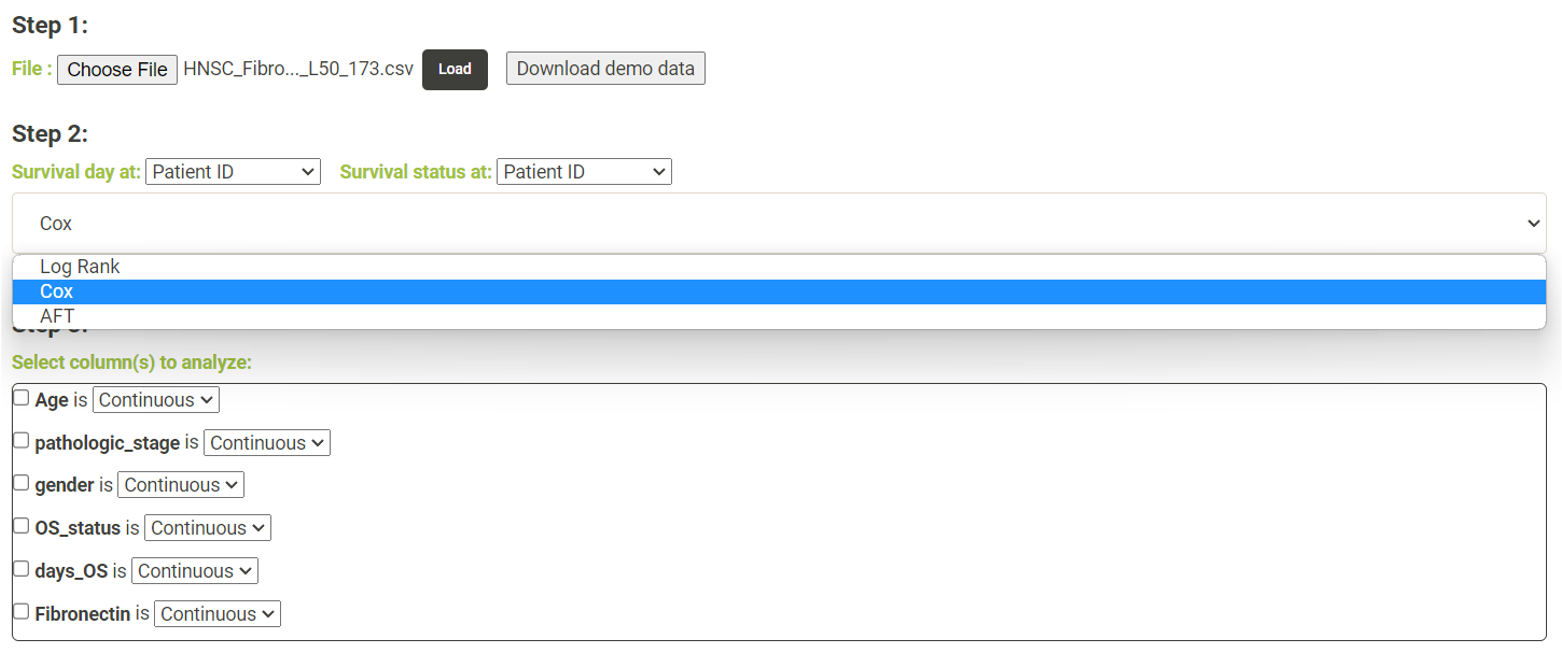 Step 3. - Log Rank. The user can select a column from the radio buttons and click 'Submit' (blue box). An interactive Kaplan-Meier plot will be generated (red box). *The user can customize the color/thickness of the lines and the follow up threshold or values used to split patients in the Kaplan-Meier plot. See Log-Rank test for more details.  Step 3. - Cox and AFT. In Cox and AFT analysis, the use needs to choose whether the columns to be analyzed are continuous or categorical. If the use chooses categorical features, the user needs to select a reference category.  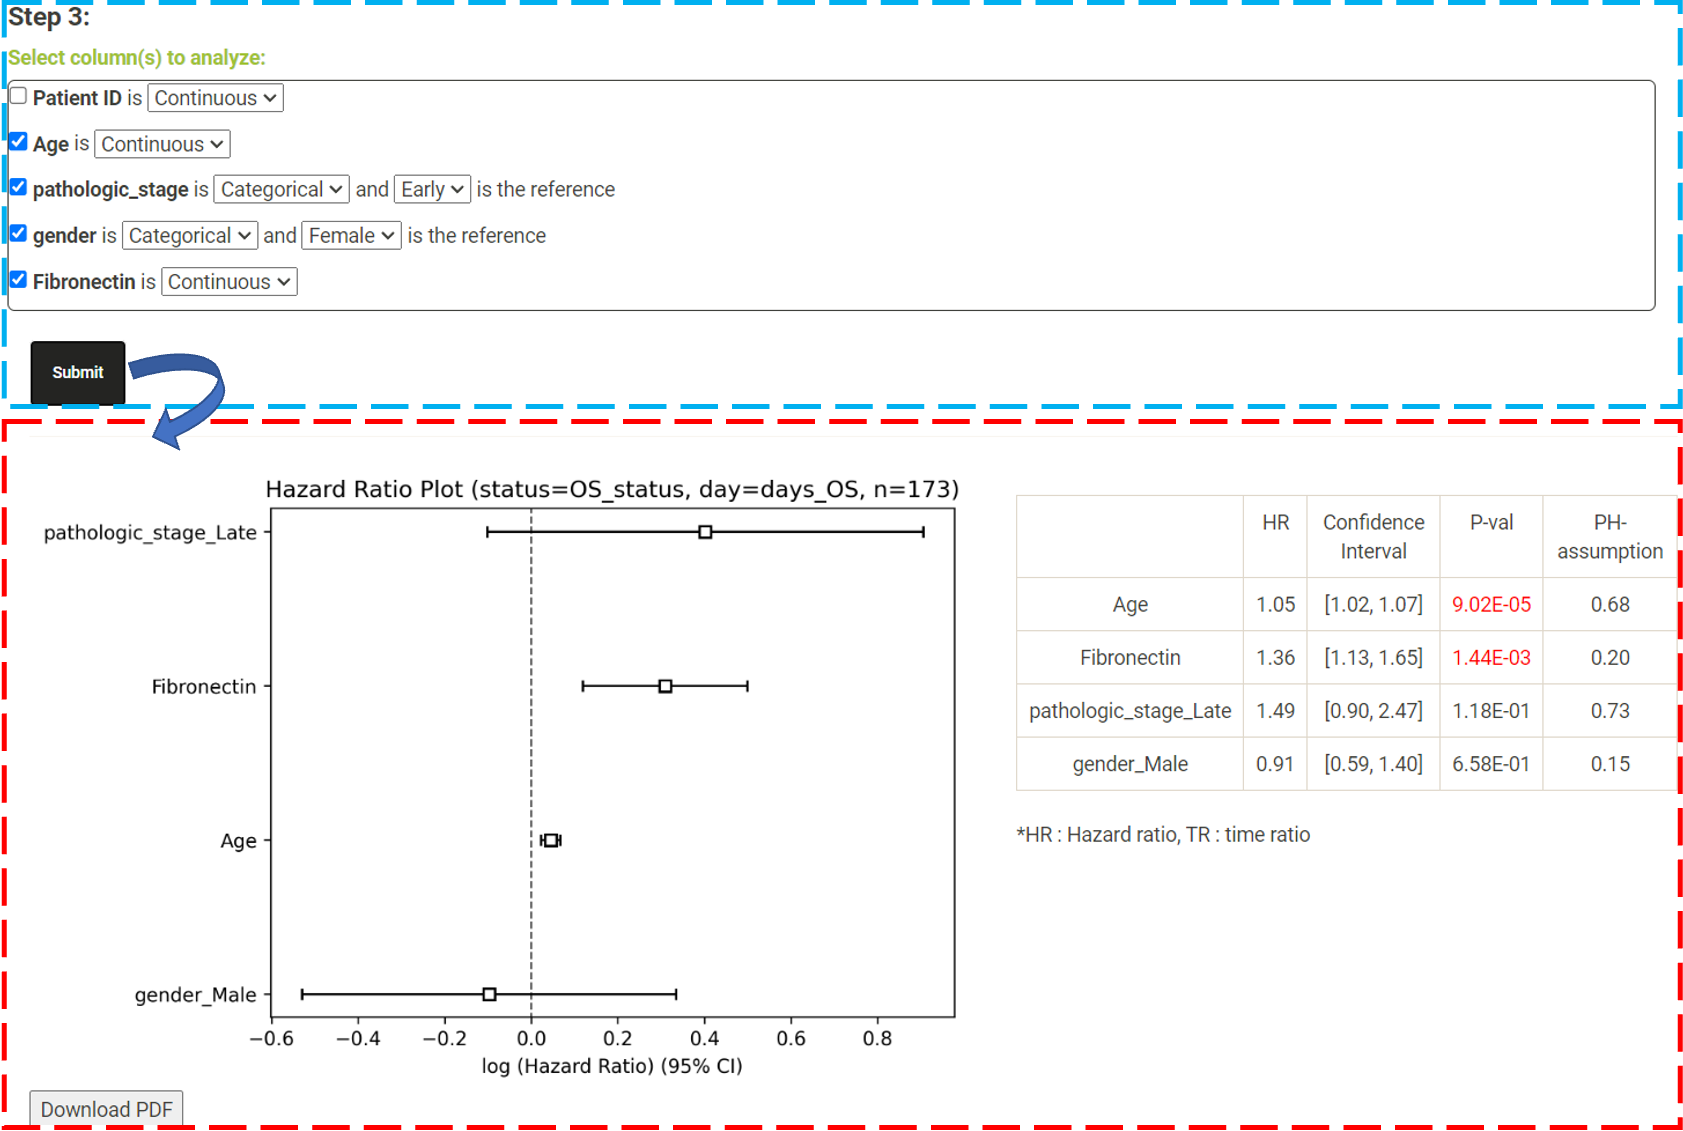
Log-rank Test
By default, DoSurvive uses the median to divide the samples into two groups, a high-expression group and a low-expression group, DoSurvive then conducts a Log-rank test for these two groups.
The log-rank test yields the overall, disease-free, disease-specific, and progression-free p-value as well as the BH adjusted p-values (False-discovery rates).
 The user can click a gene they are interested in, and this will result in overall survival, disease-free survival, disease-specific survival and progression-free survival Kaplan-Meier plots. By default, the red line represents the high-performance group, the blue line represents the low-performance group, and n represents the sample sizes. DoSurvive allows the user to customize the Kaplan-Meier plot, i.e line thickness and color, size of plot, follow up threshold (years), and the percentages used to separate two groups of patients in Kapan-Merier plot. In addition, DoSurvive can automatically divide patients into two groups by adjusting the percentage cutoff by 5% increments and determine the best cutoff with the lowest p-value. DoSurvive also provides quartile, tertile, manual cutoff for dividing the data. Clicking "Submit" the Kaplan-Meier plot will be reproduced (red box). 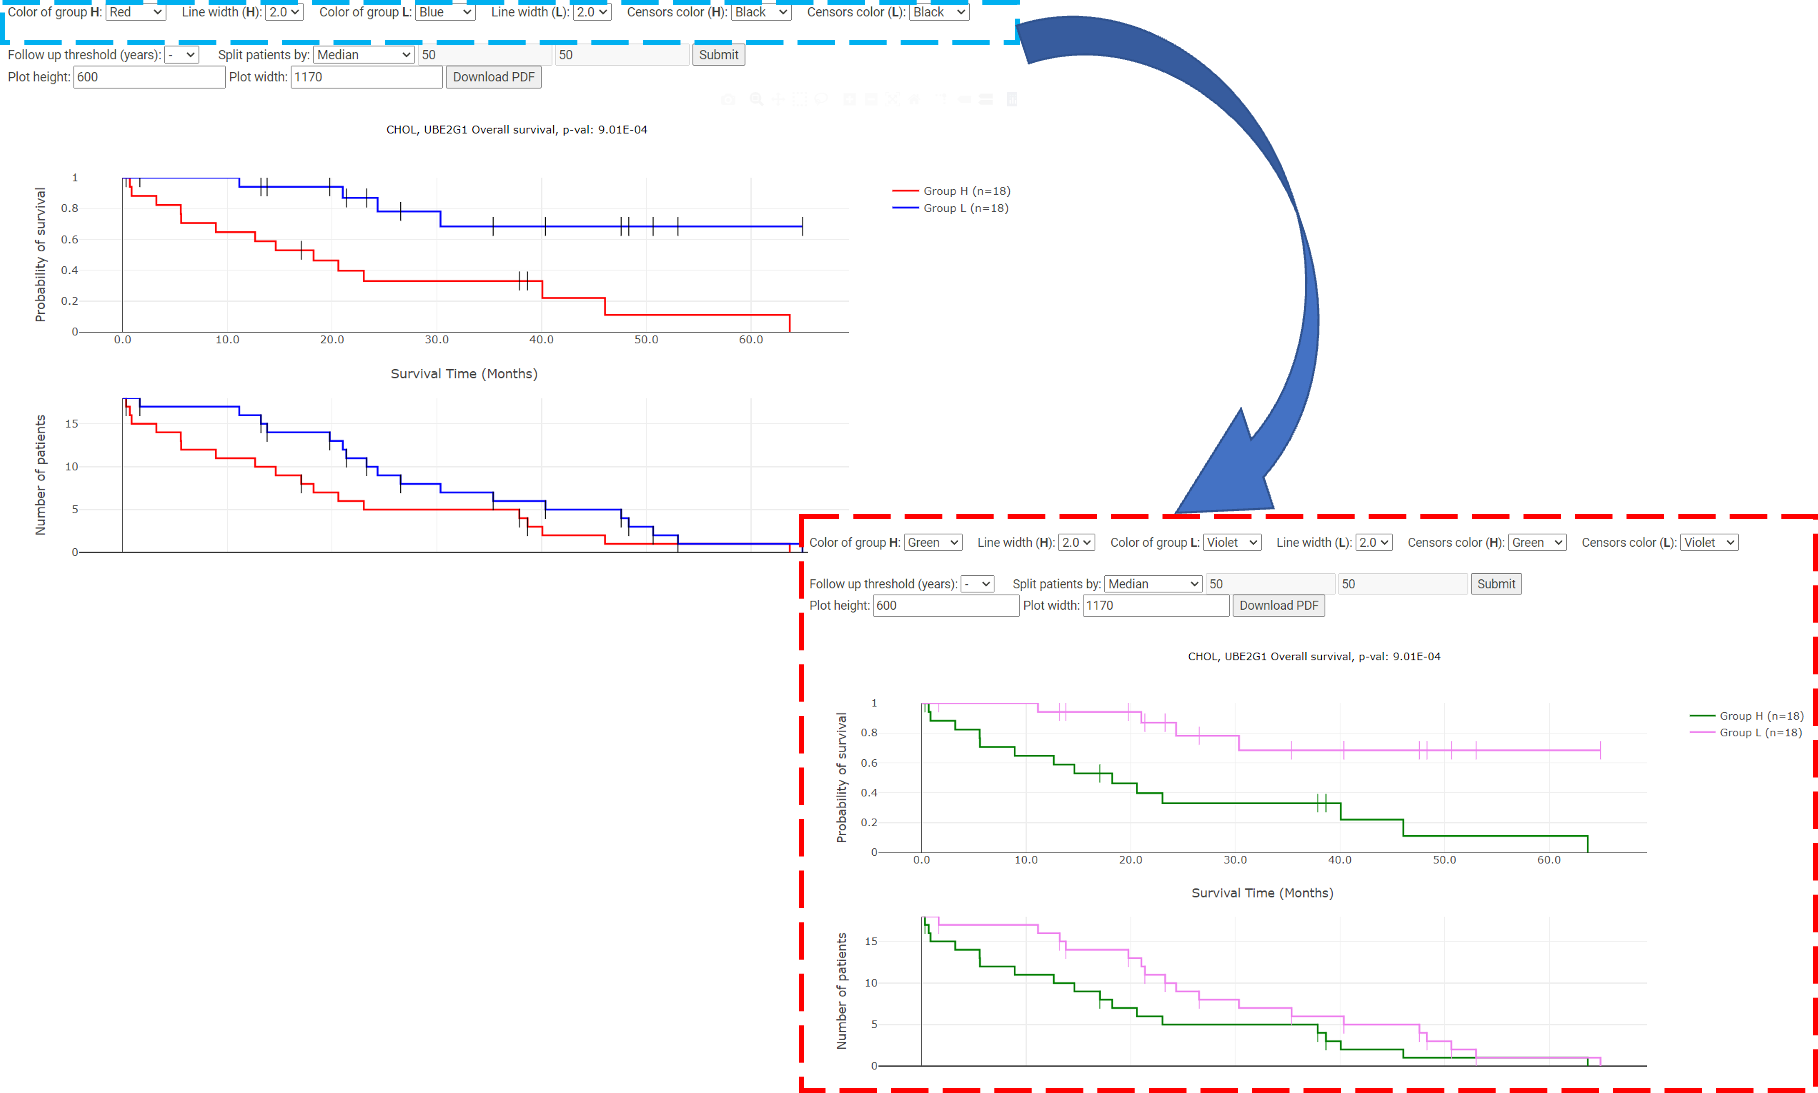
Cox Proportional Hazard model (Cox Regression)
The purpose of the Cox model is to evaluate the simultaneous effect of several
factors on survival. In other words, it allows us to examine how specific
factors influence the rate of a particular event happening (e.g., infection,
death) at a particular point in time. This rate is commonly referred to as the
hazard rate. Predictor variables (or factors) are usually termed covariates in
the survival-analysis literature.
The Cox model is expressed in terms of the hazard function, denoted by h(t), which briefly can be interpreted as the relative risk of dying between times t and t+s, given survival to time t (where s is a small value). In the cox model, the form of the hazard function is given by : 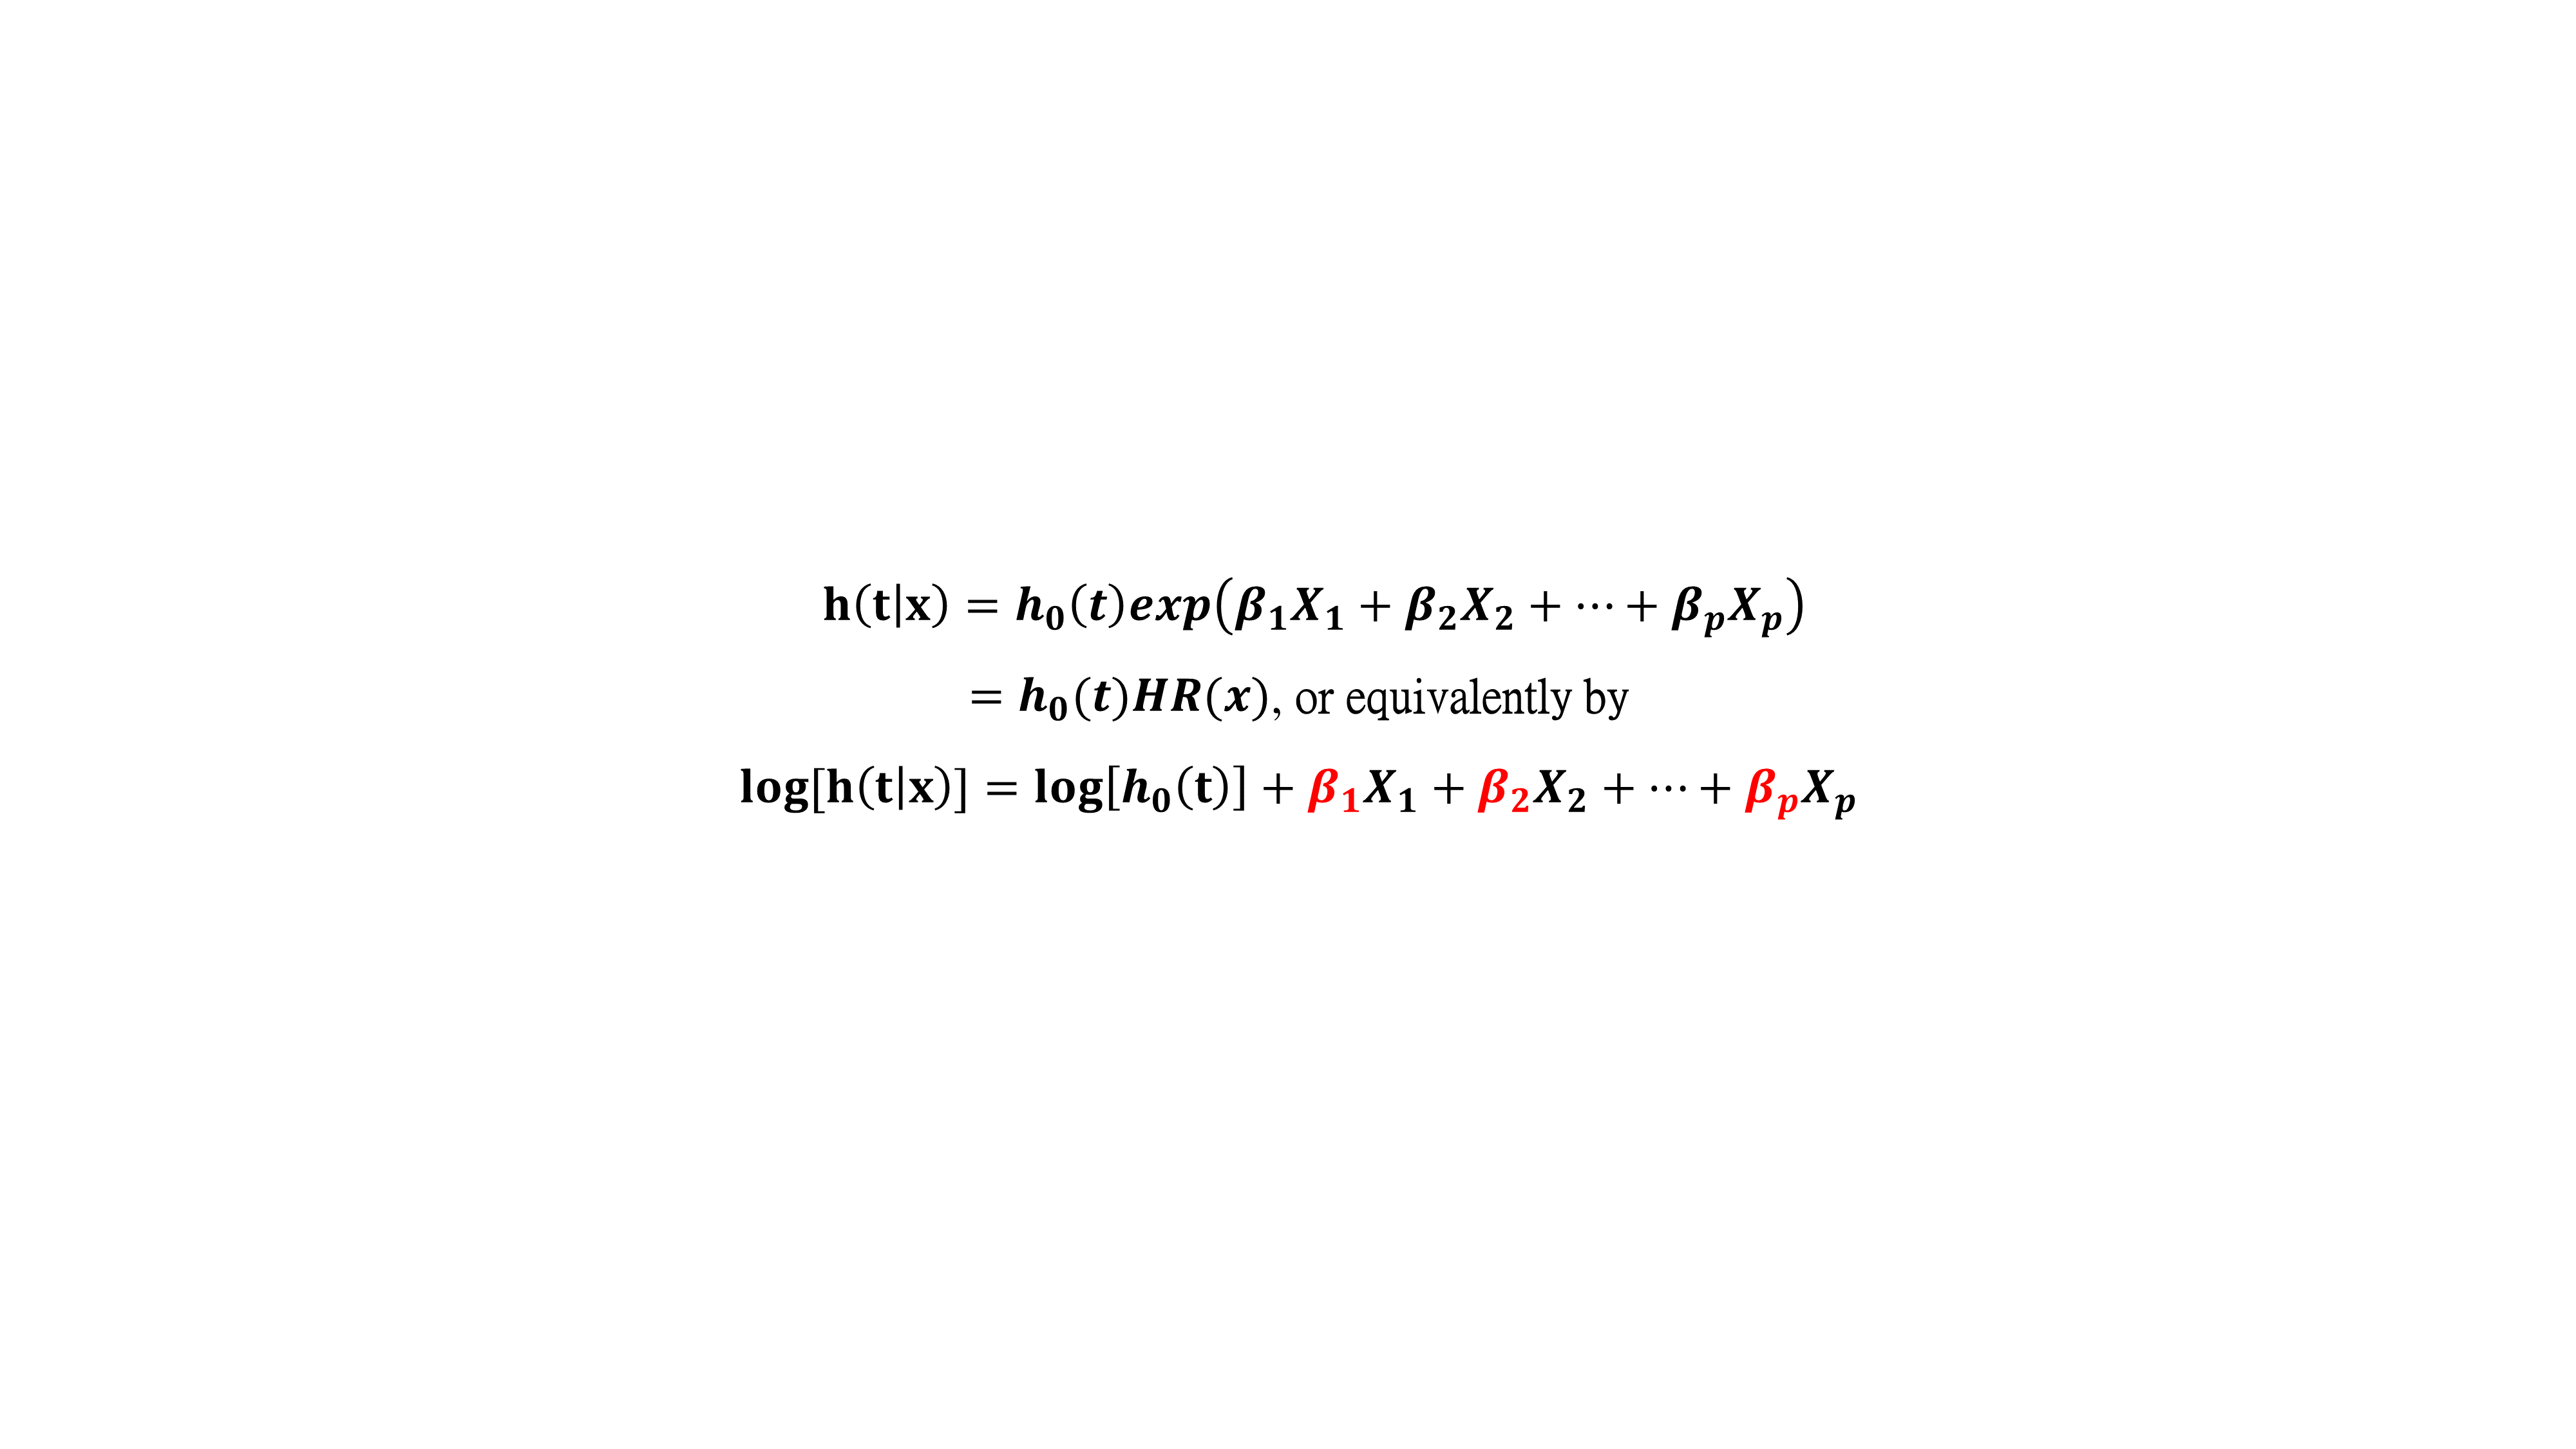 In the Cox regression results, a p-value of < 0.05 for coefficient βi indicates that gene expression i has a significant impact on the hazard (i = 1,2,....,p). Red signifies a p-value of < 0.05 and a positive coefficient (βi > 0), indicating that the increase in the expression of this gene has a negative impact on survival; Green signifies a p-value of < 0.05 and a negative coefficient (βi < 0), indicating that the increase in the expression of this gene has a positive impact on survival.  In "Cox regression results", the user can also click a gene/survival type to plot the hazard ratio plot. DoSurvive provides both a hazard ratio plot and a table for the hazard ratios, confidence intervals, p-values, and proportional hazard assumption p-values. The user can remove unwanted features from the Cox model and reanalyze by unchecking variables (blue box) to get new results (red box). 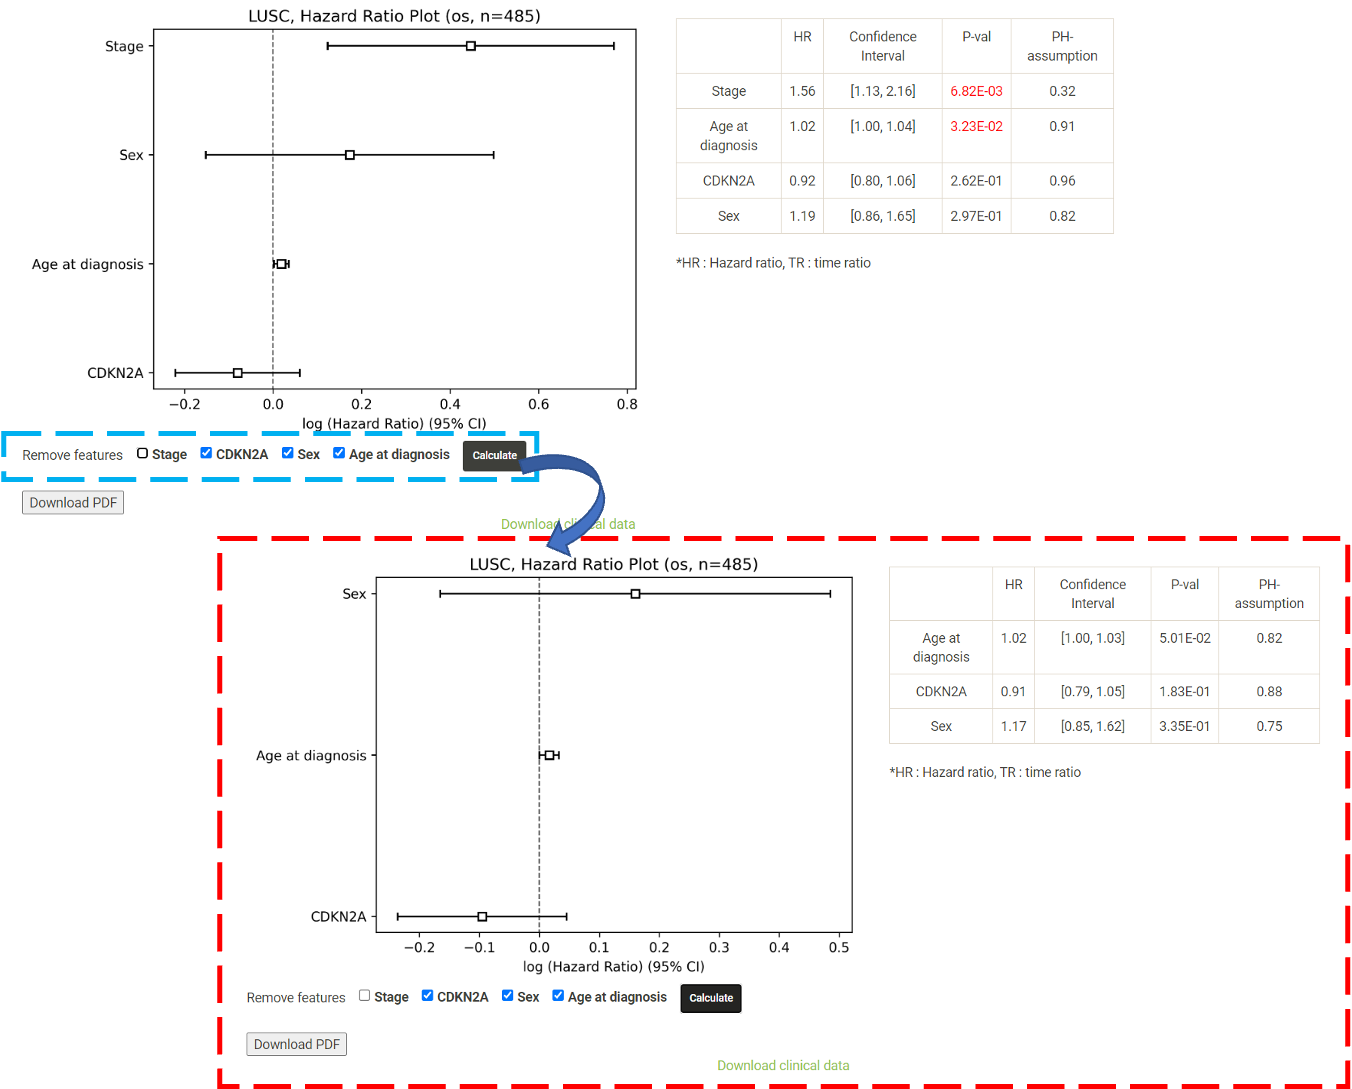
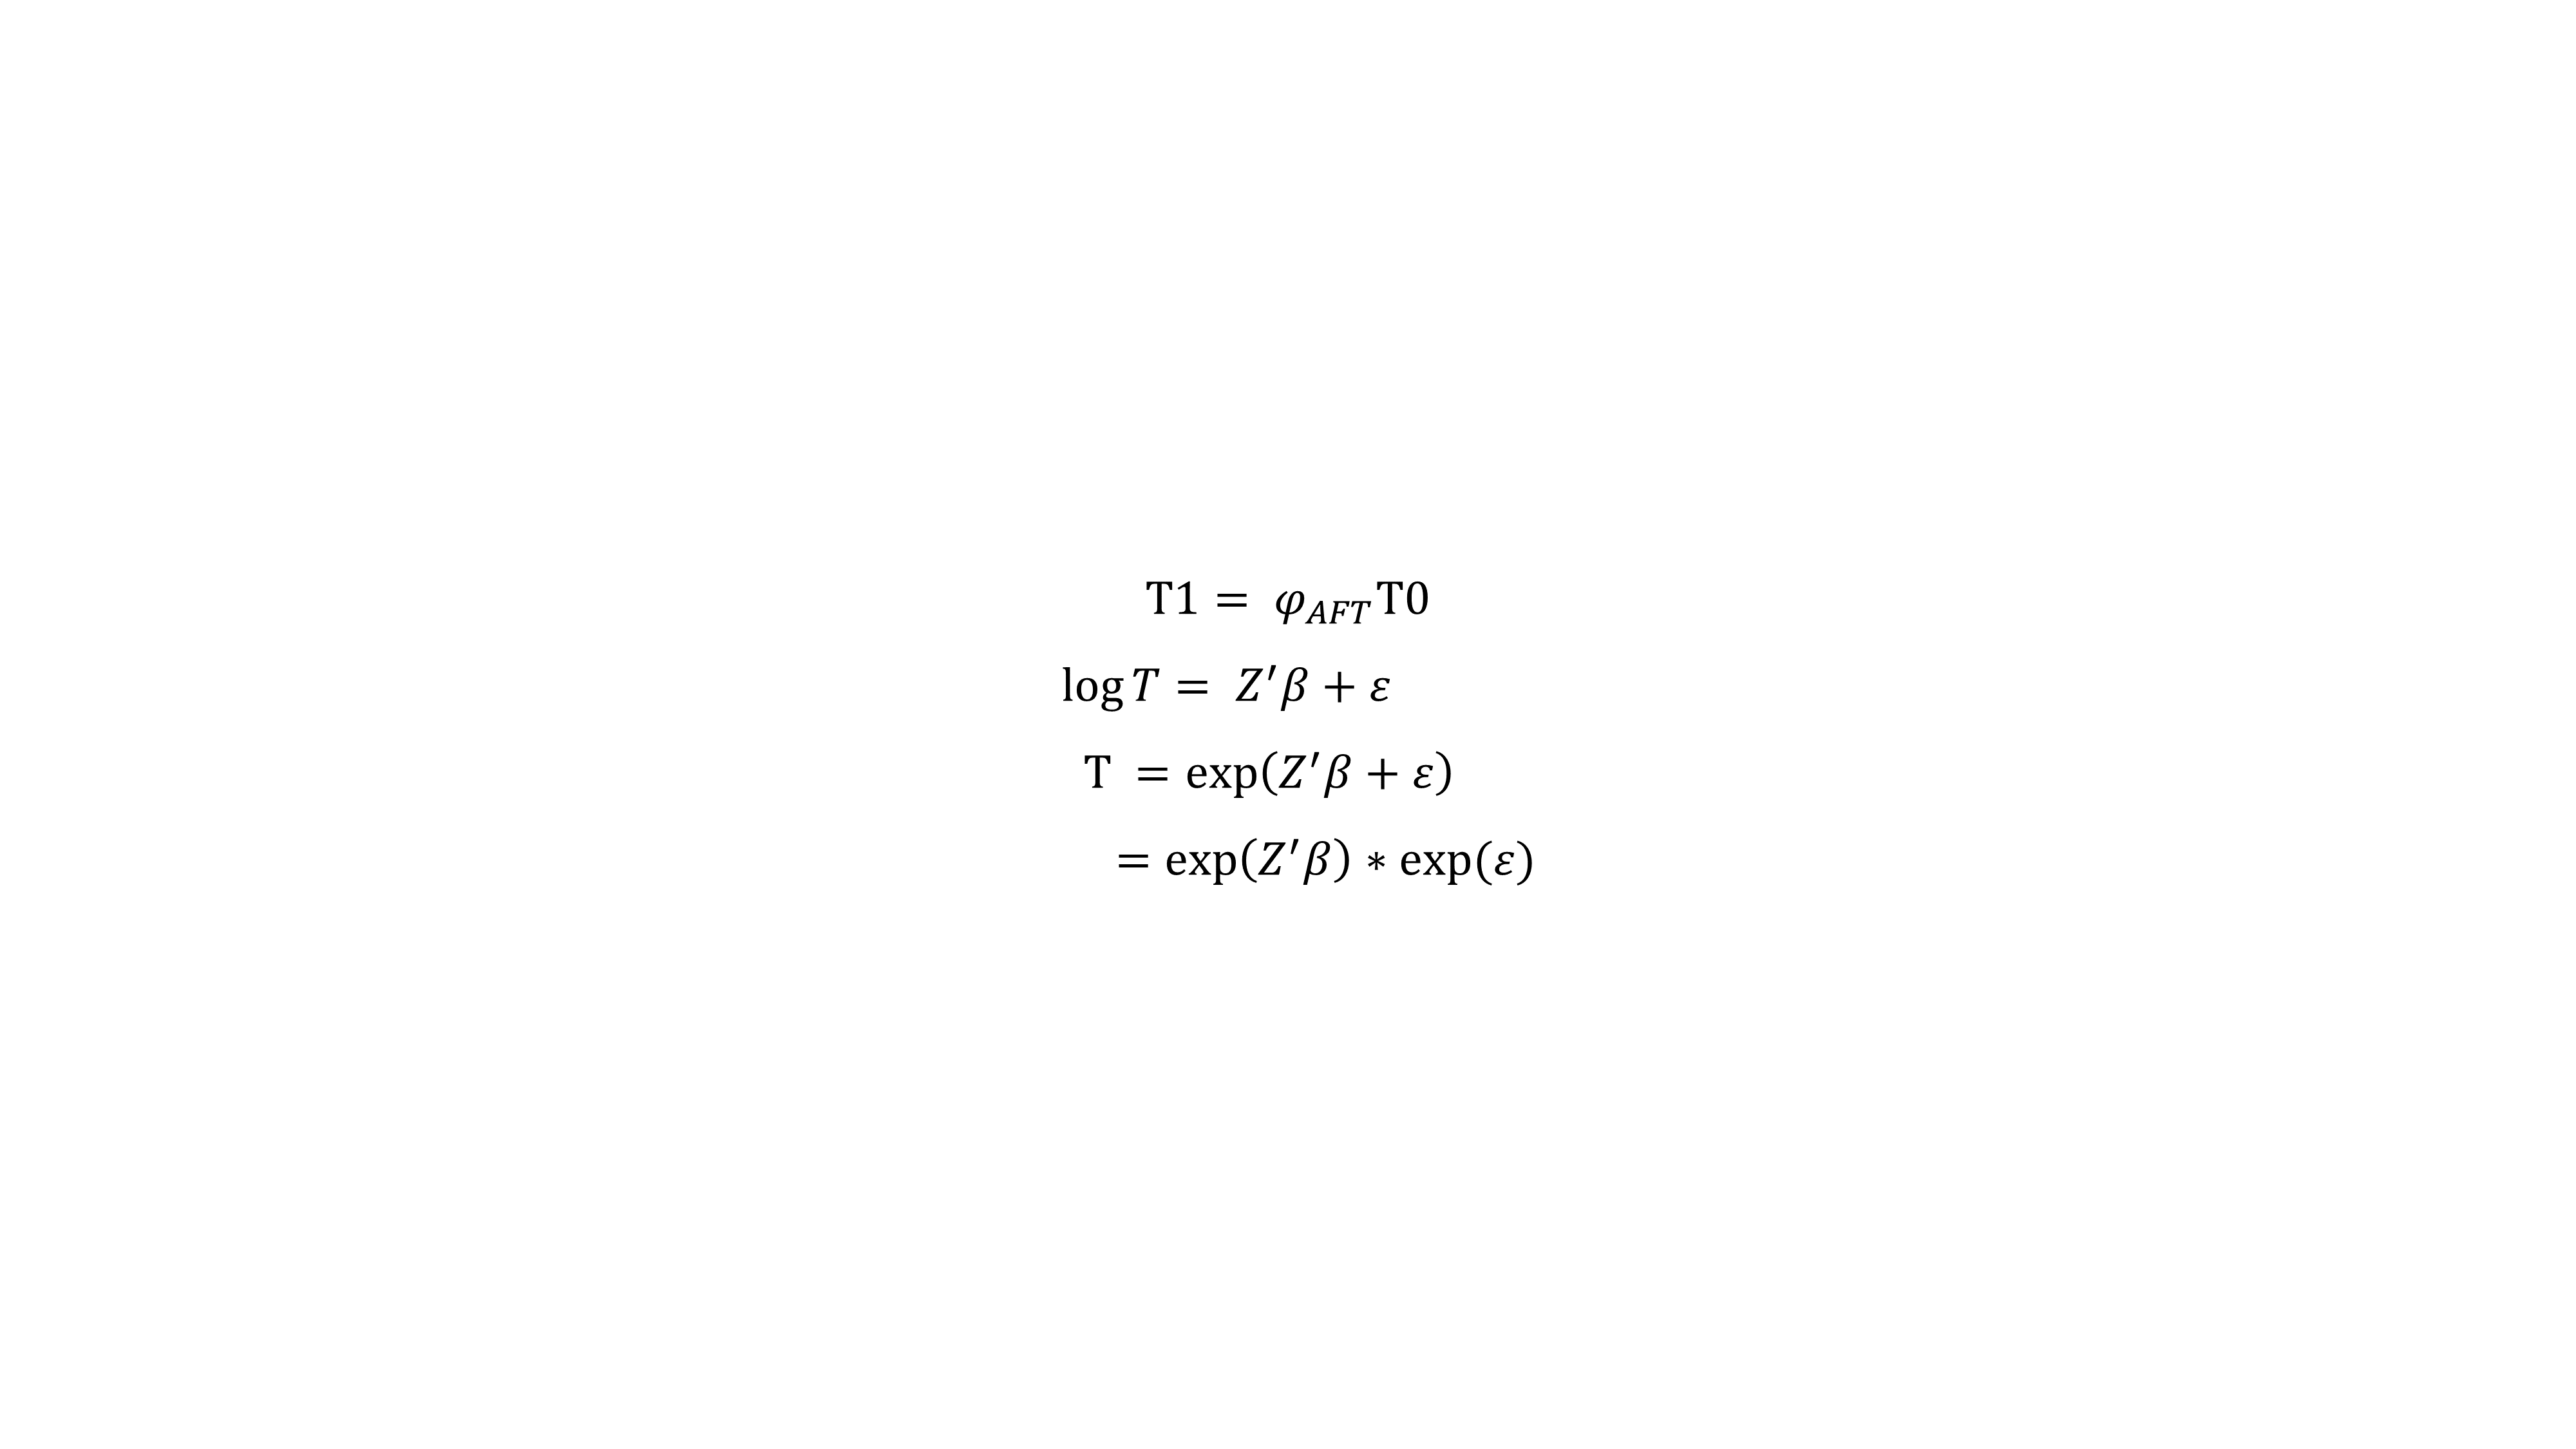
Accelerated Failure-Time model (AFT)
In survival analysis, an accelerated failure time model (AFT
model) is a parametric model that provides an alternative to the commonly used
proportional hazards models. Whereas a proportional hazards model assumes that the
effect of a covariate is to multiply the hazard by some constant, an AFT model
assumes that the effect of a covariate is to
accelerate
or
decelerate
the life course of a disease by some constant.
Red indicates p-value < 0.05 and coefficient is negative
, indicates that the increase in the expression of this gene have a
negative impact
on survival which ;
Green indicates p-value < 0.05 and coefficient is positive
, indicates that the increase in the expression of this gene has a
positive impact
on survival. In full generality, the accelerated failure time model can be specified as :
 In the AFT results, the user can also click a gene/survival type to plot the time ratio. 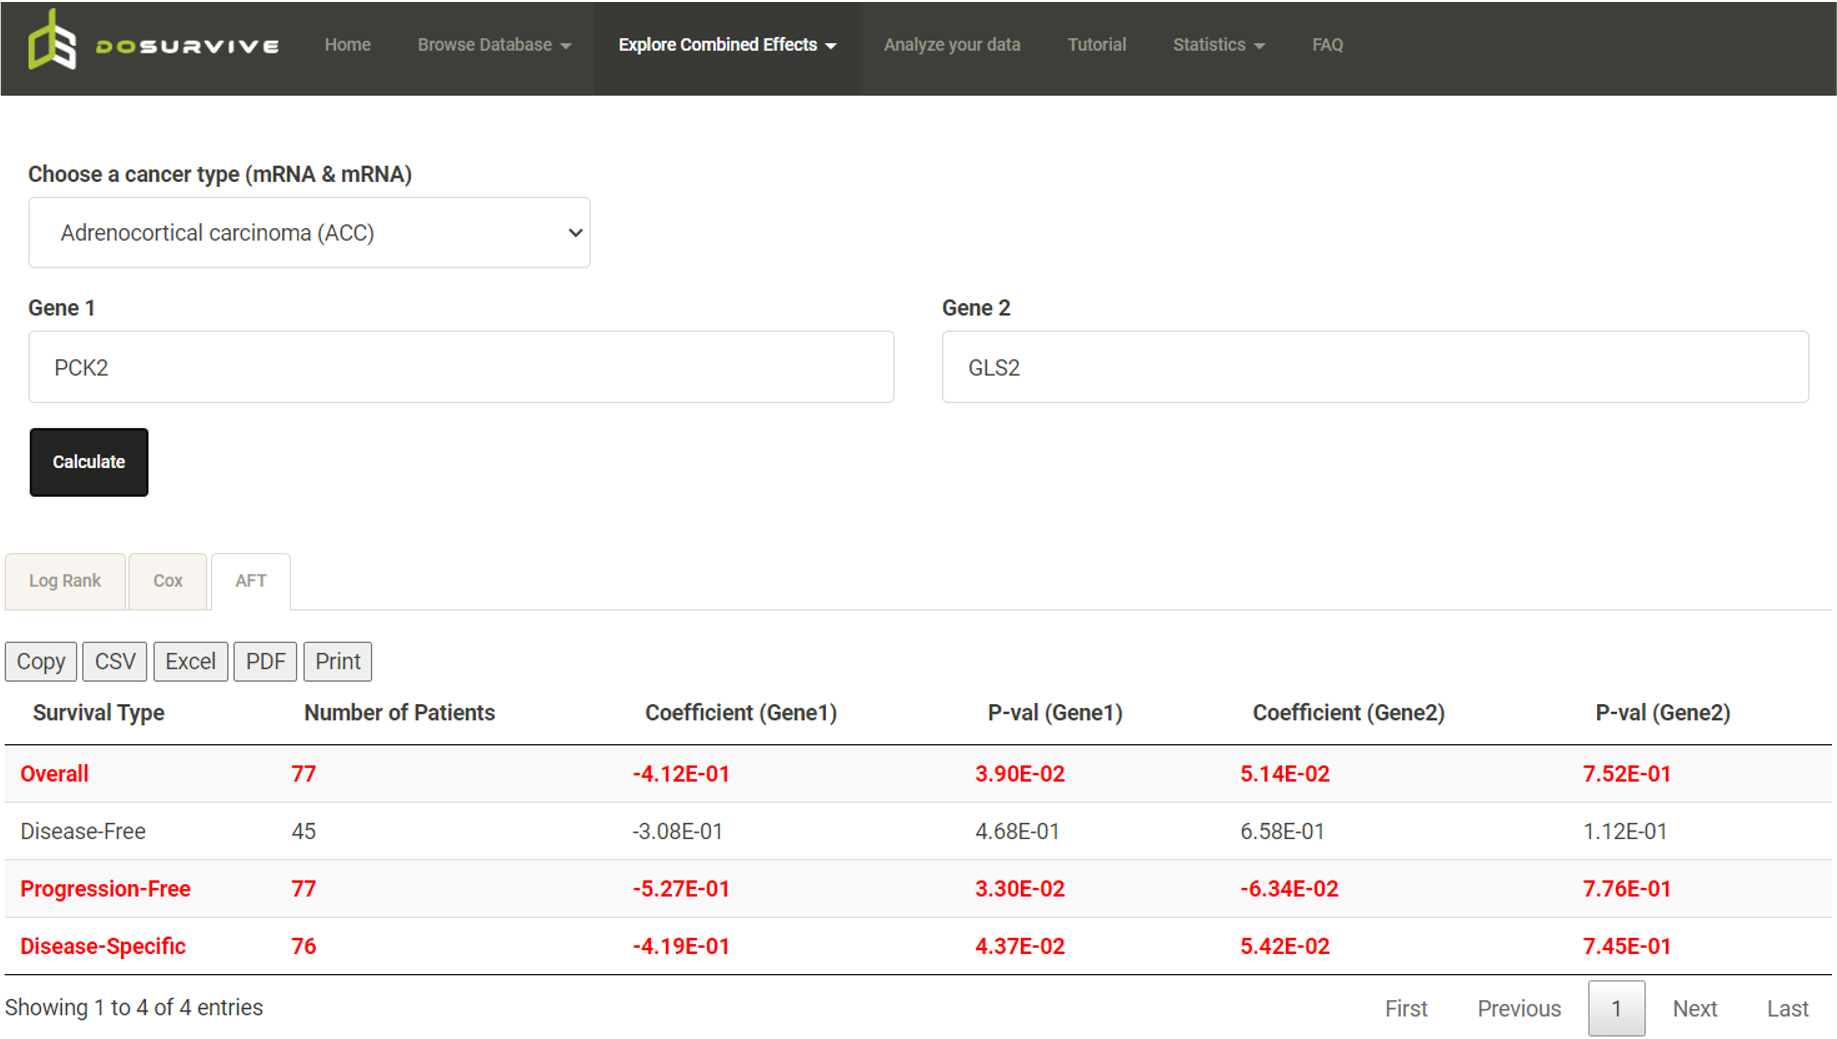 The user can remove unwanted features from the AFT model and reanalyzed by unchecking variables (blue box) to get new results (red box). 
Expression/Methylation Profiles
DoSurvive provides the profiles for the expression levels of a specific gene
(mRNA/miRNA/lncRNA) or protein and methylation levels for CpG sites in different
cancer types.
* Gene/protein: In the "Expression" tab, Expression (Normal) represents the average expression of all normal samples; Expression (Tumor) represents the average expresssion of all tumor samples. DoSurvive also calculates the Wilcoxon-rank sum test to confirm whether there is a significant difference between the expression levels in normal samples and in tumor samples. 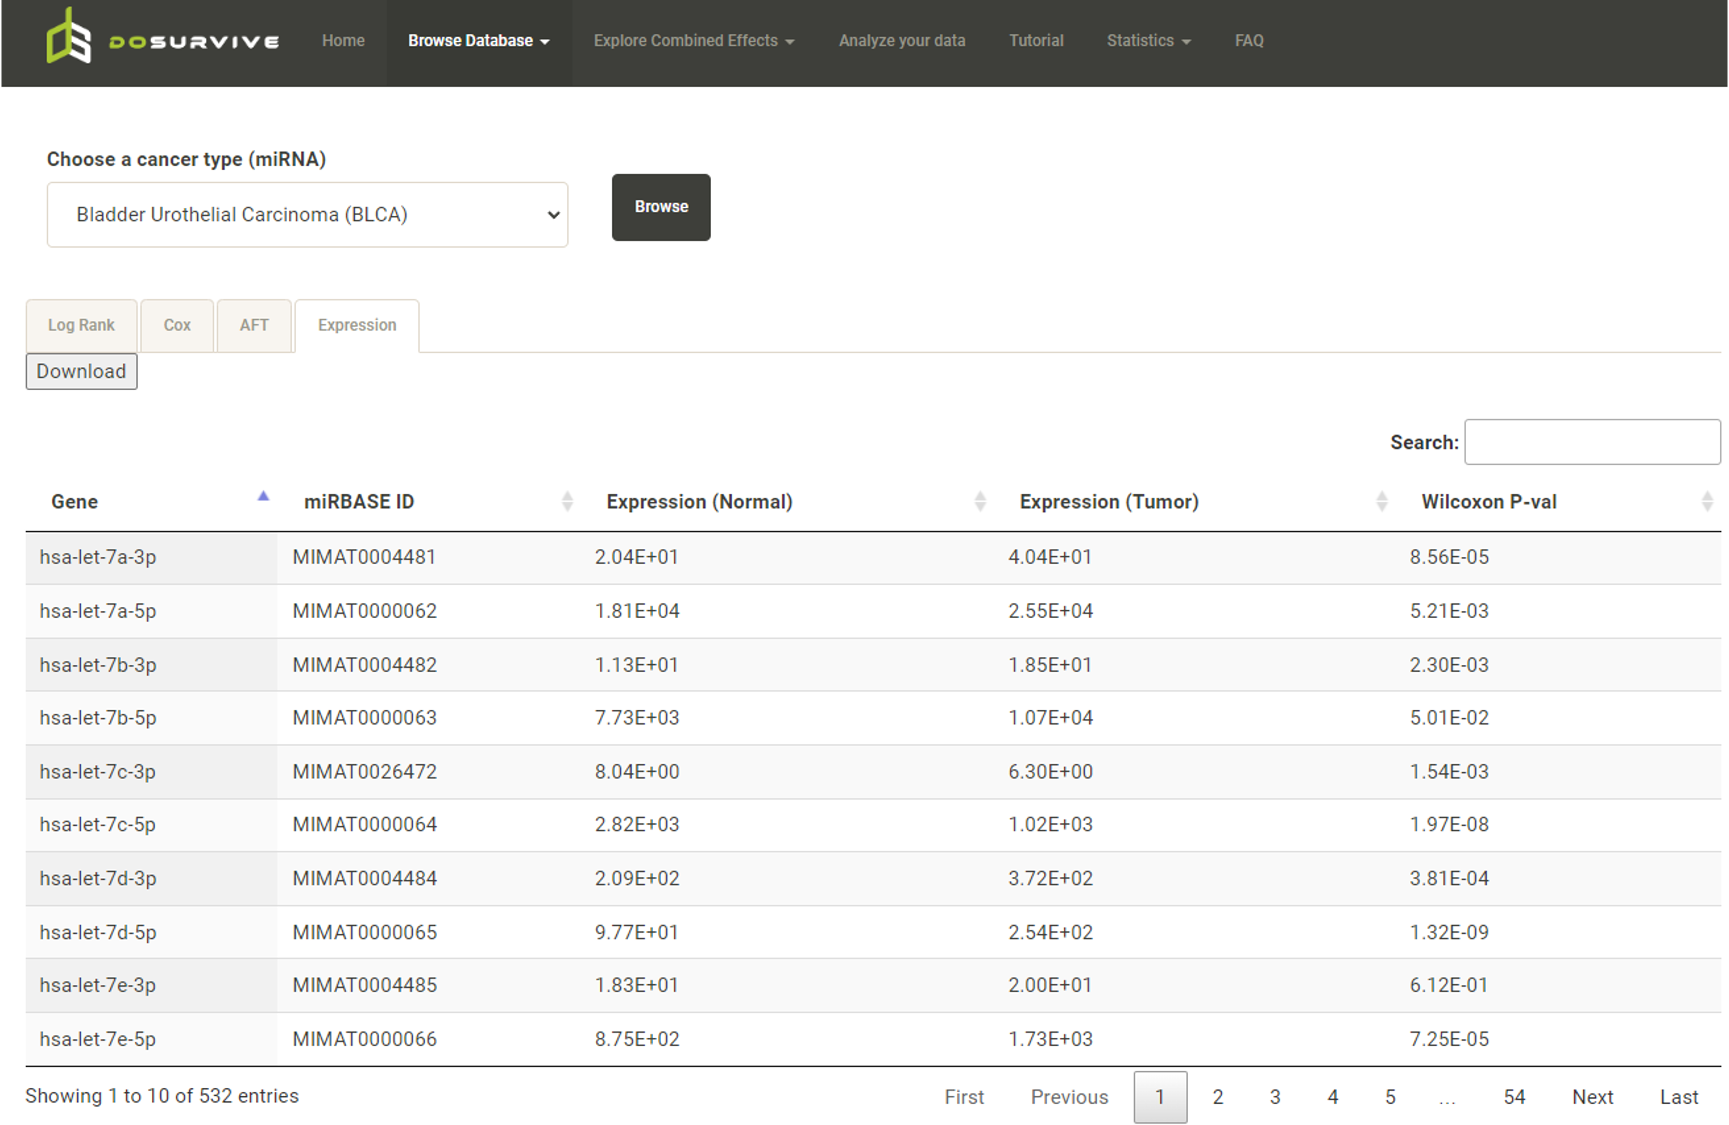 By clicking on features of interest, an interactive box plot of the expression levels across cancer types will be generated.  * CpG sites: For a gene of interest, the user can retrieve the methylation levels of its upstream CpG sites via click buttons labeled as 27k or 450k in the table (blue box). A pop-up window for the survival analysis results and Expression profile of the methylation levels from the upstream CpG sites will be shown (red box). 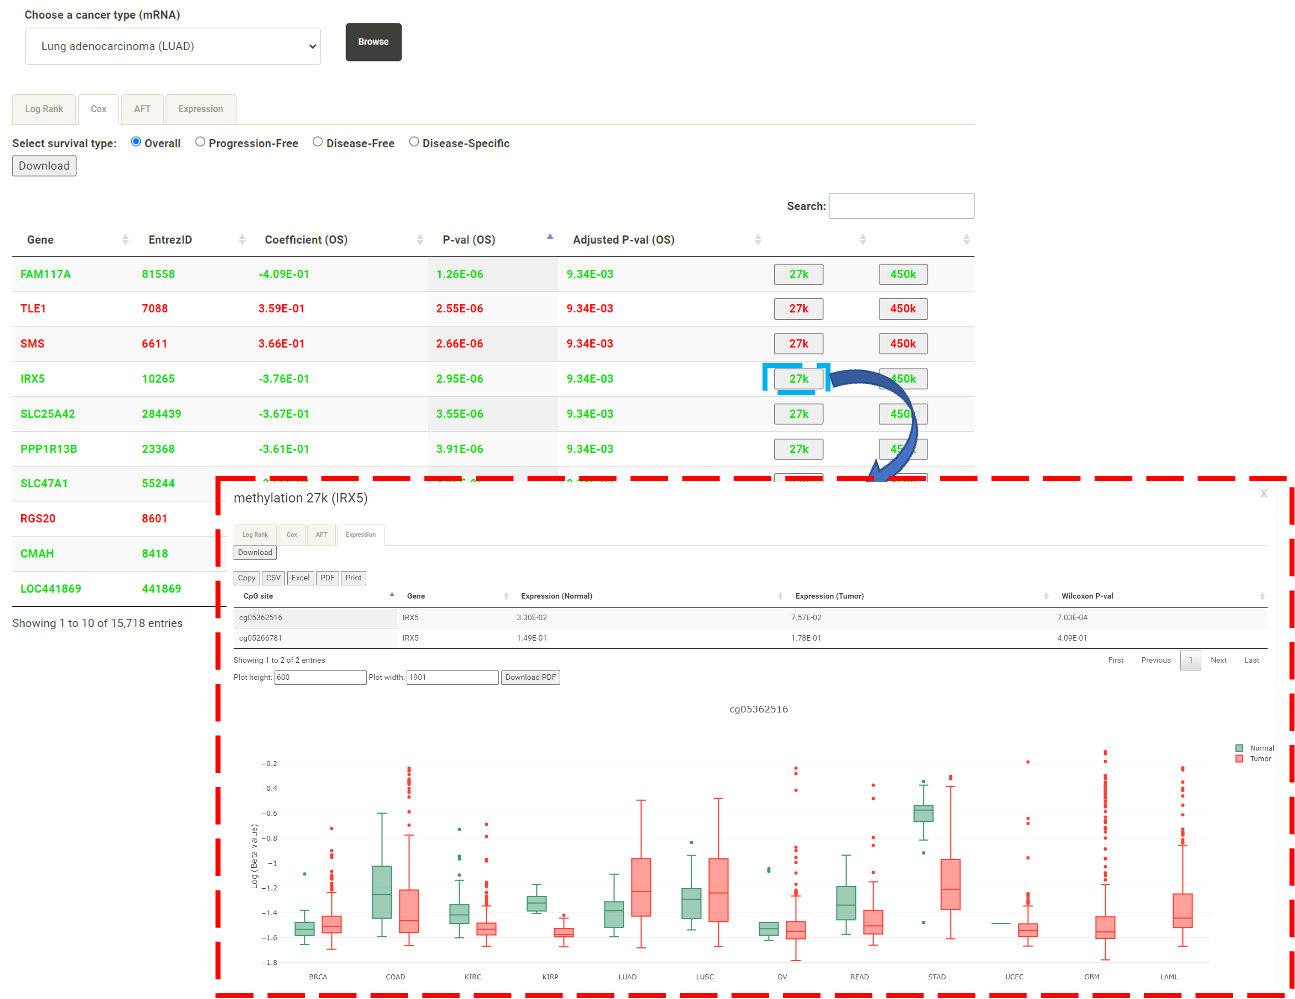
The Correlation of mRNA & Methylation
If a user wants to further explore how methylation regulates mRNA, DoSurvive provides
the relationship between the expression level of mRNA and the methylation levels of
its upstream CpG sites.
In the table for mRNA, the user can click 27k or 450k (blue box) to display the analysis results (red box) for the methylation levels detected from different methylation arrays, i.e. Illumina Infinium HumanMethylation27 BeadChip and Illumina Infinium HumanMethylation450 BeadChip. 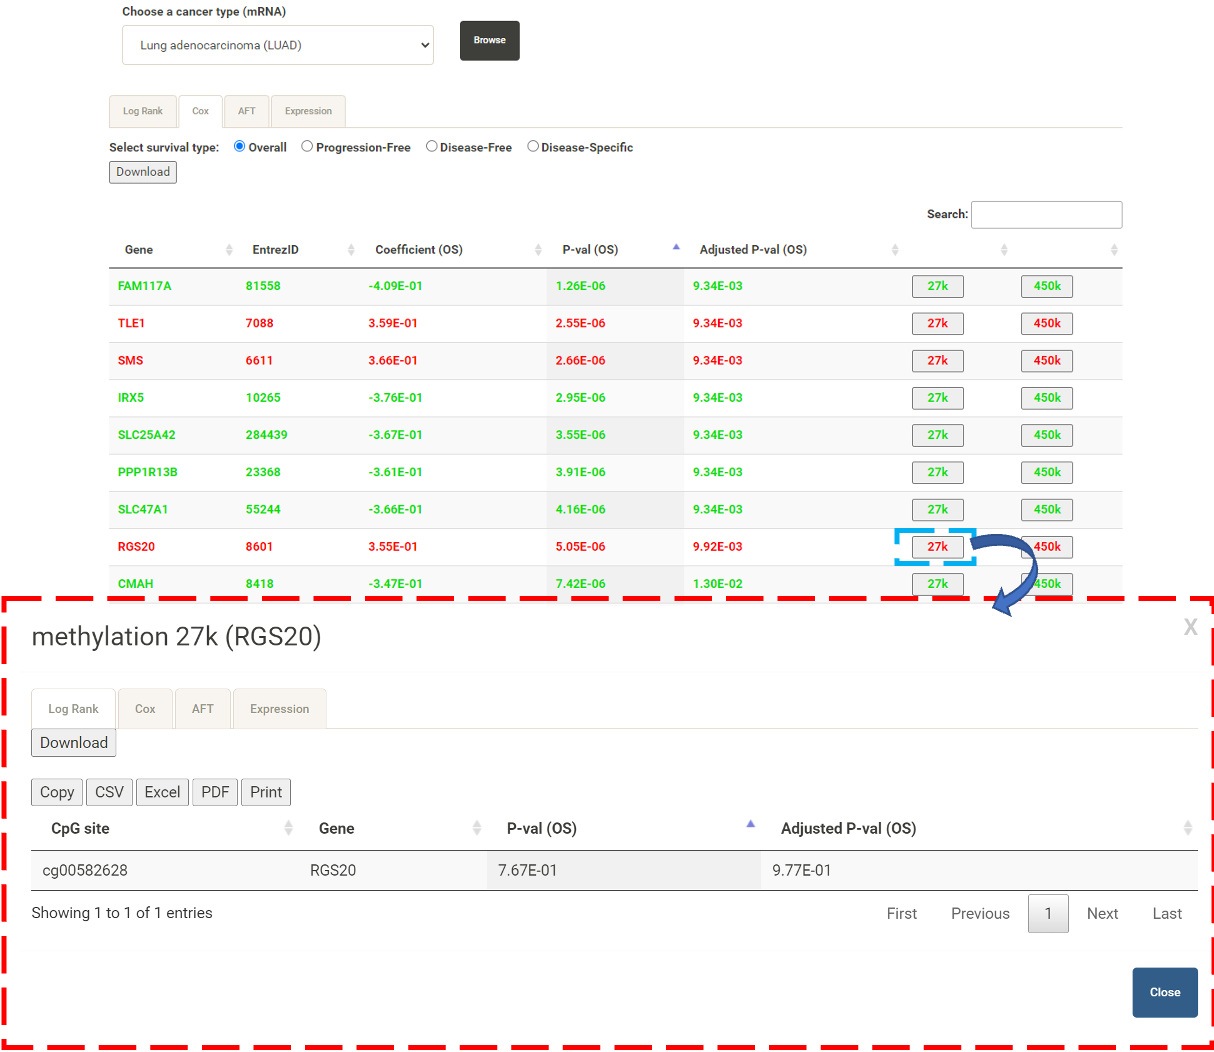 By clicking the "Expression" tab, the user can select the CpG site of interest and then click "Start" to explore the correlation between the expression level of the selected gene and the methylation level of its upstream CpG site(s). 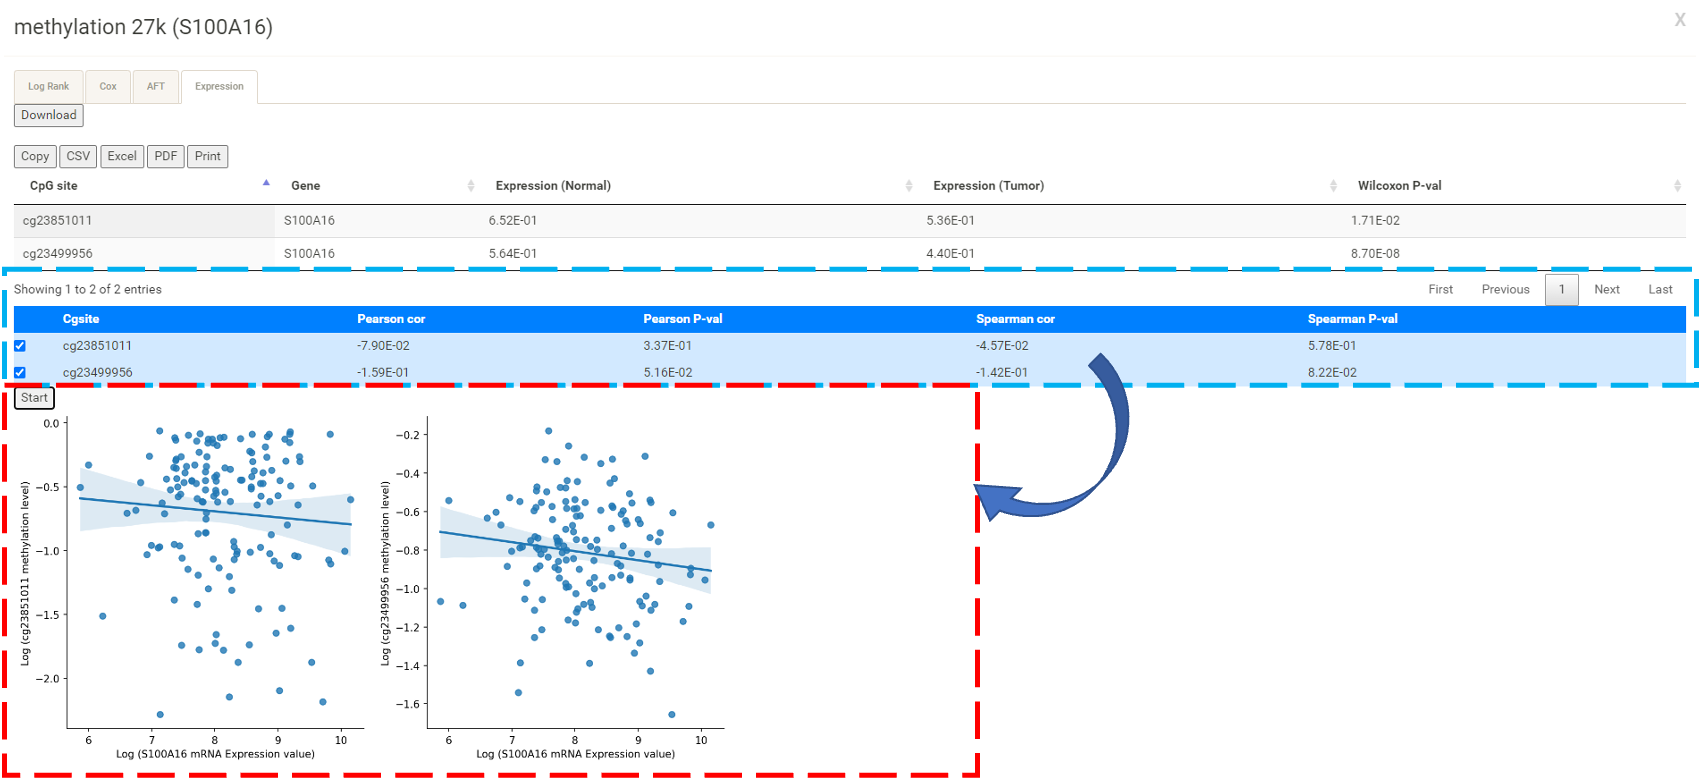
Download data
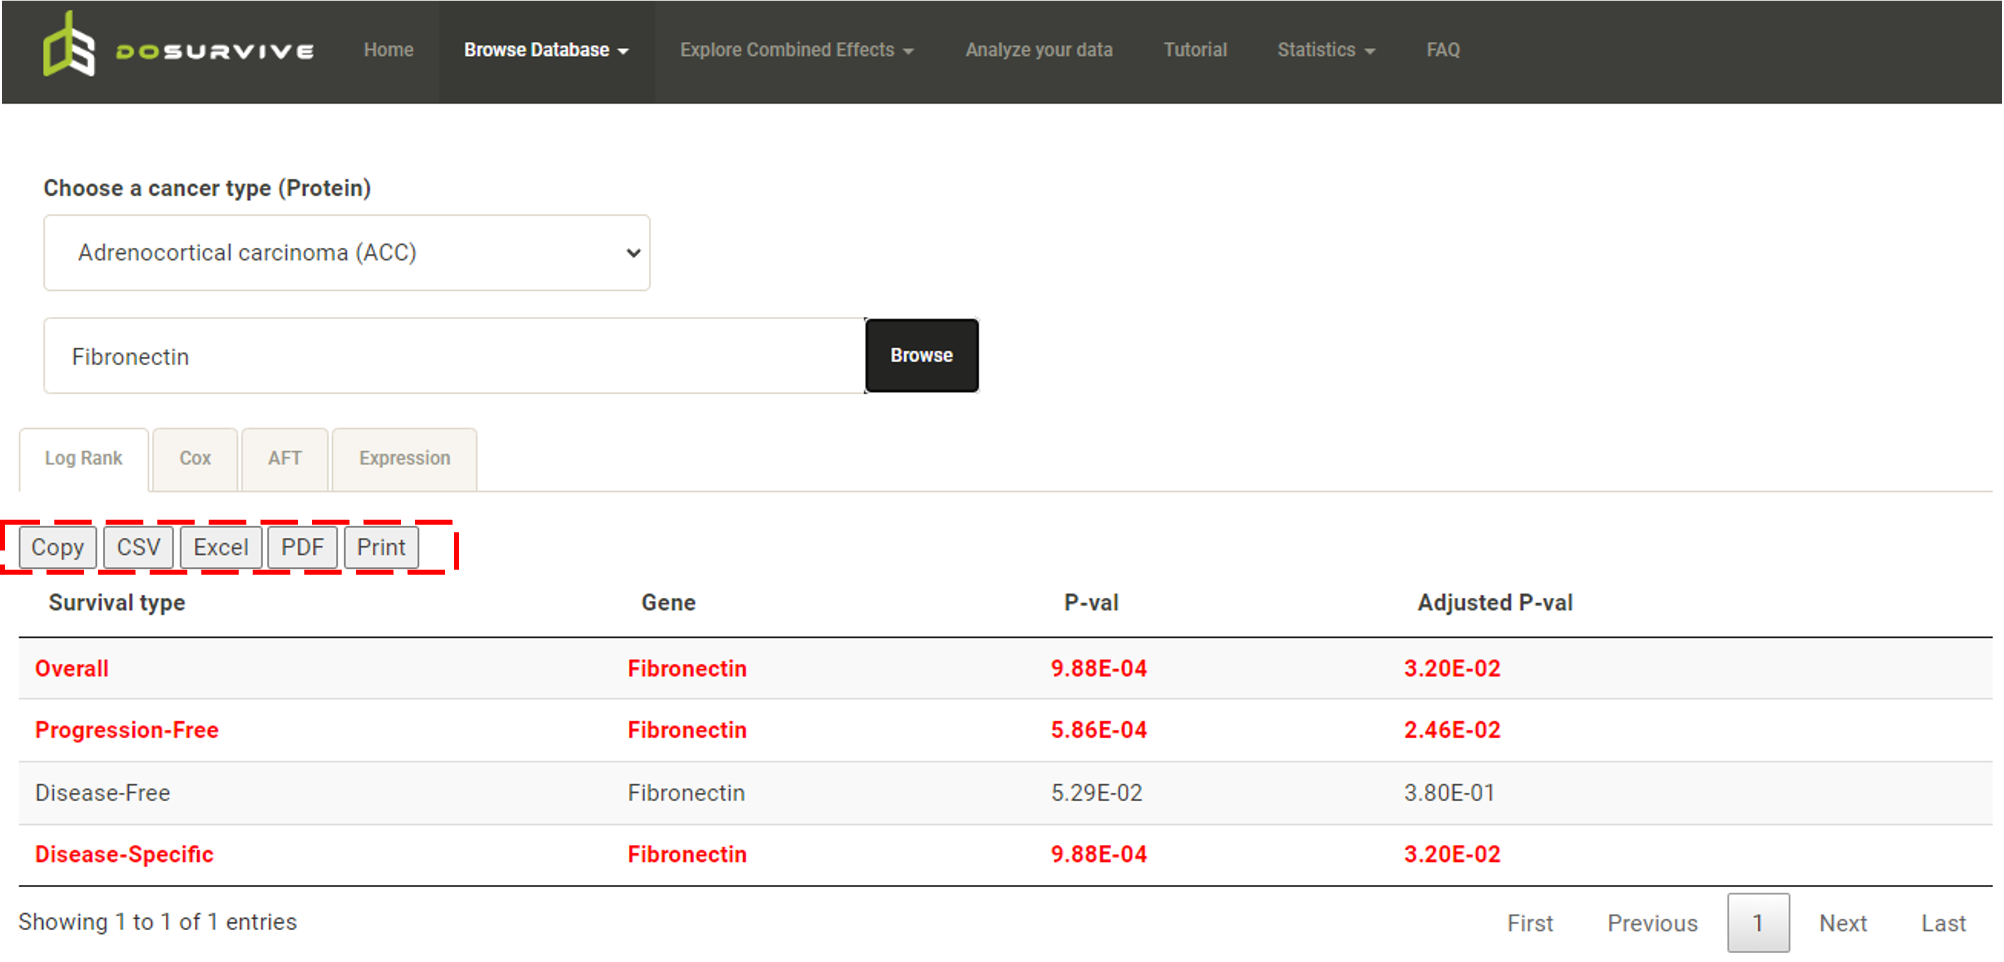
Tables of all analysis results can be downloaded. The user can click "Download", "Copy", "CSV", "Excel", "PDF" or "Print"
to get the whole table.
  In addition to the results table, all the clinical data used in the survival analysis can be downloaded for further analysis. 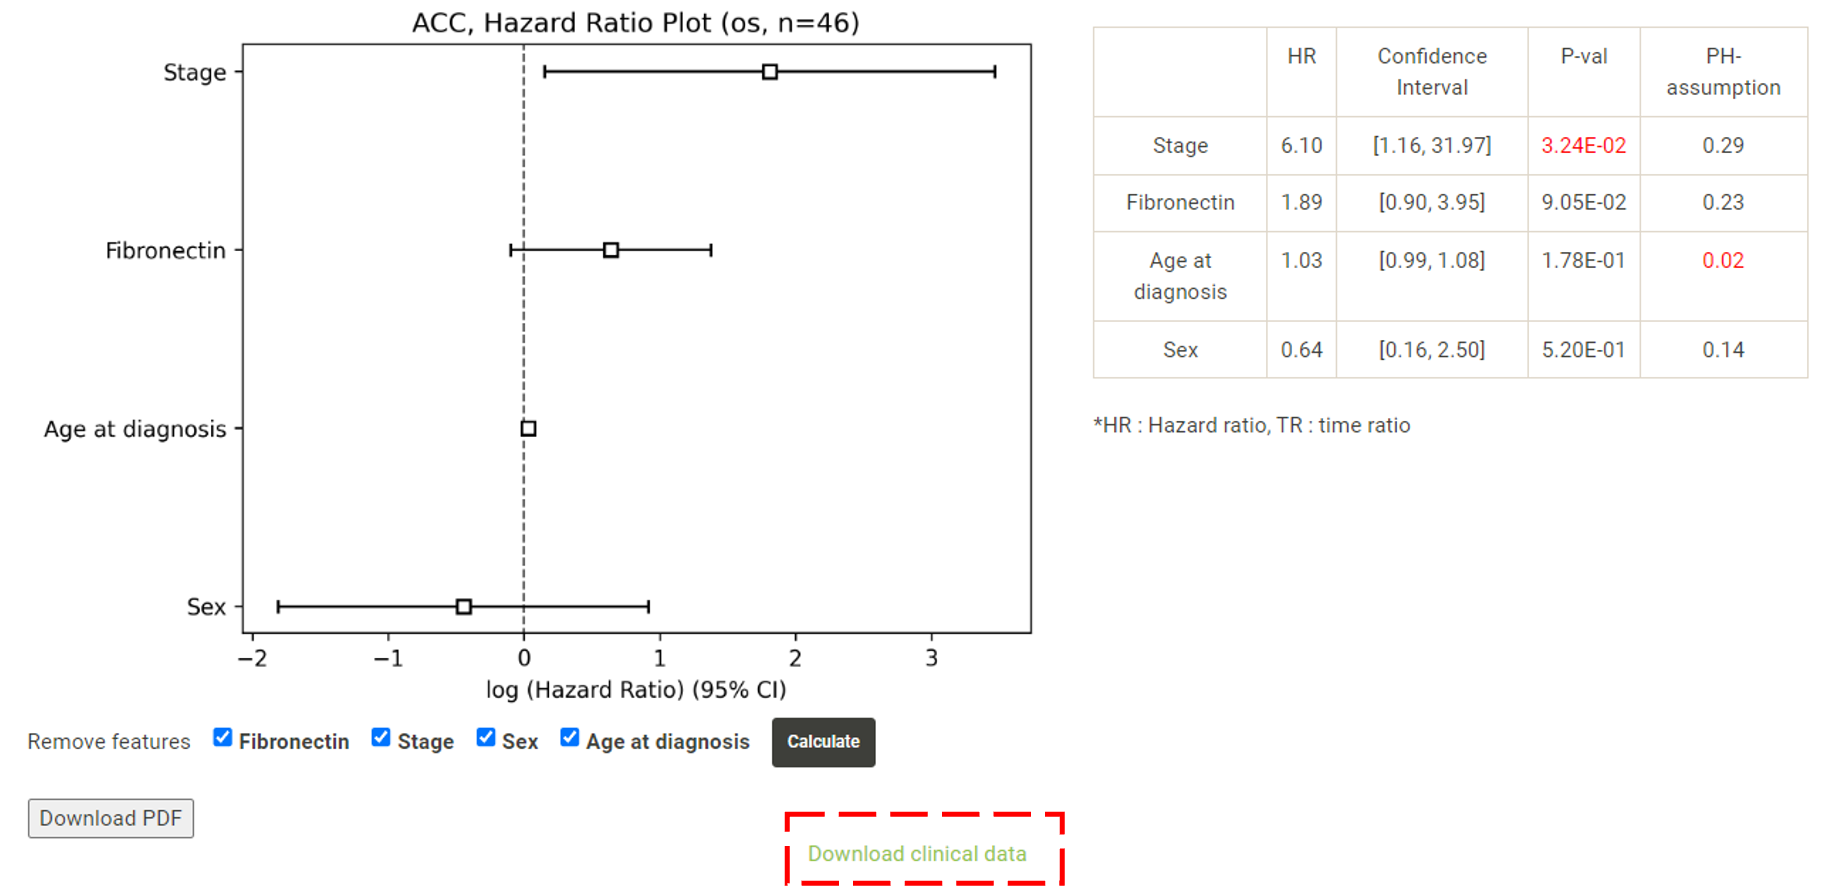 The downloaded clinical data has been processed, "pathologic_stage" has been classified as a categorical variable, "0" to represent early stage, "1" to represent lately stage. "gender" has been classified as a categorical variable, "0" to represent female, "1" to represent male. Expression data has been normalized (red box). The remaining columns provide user reference and do not participate in the regression model. 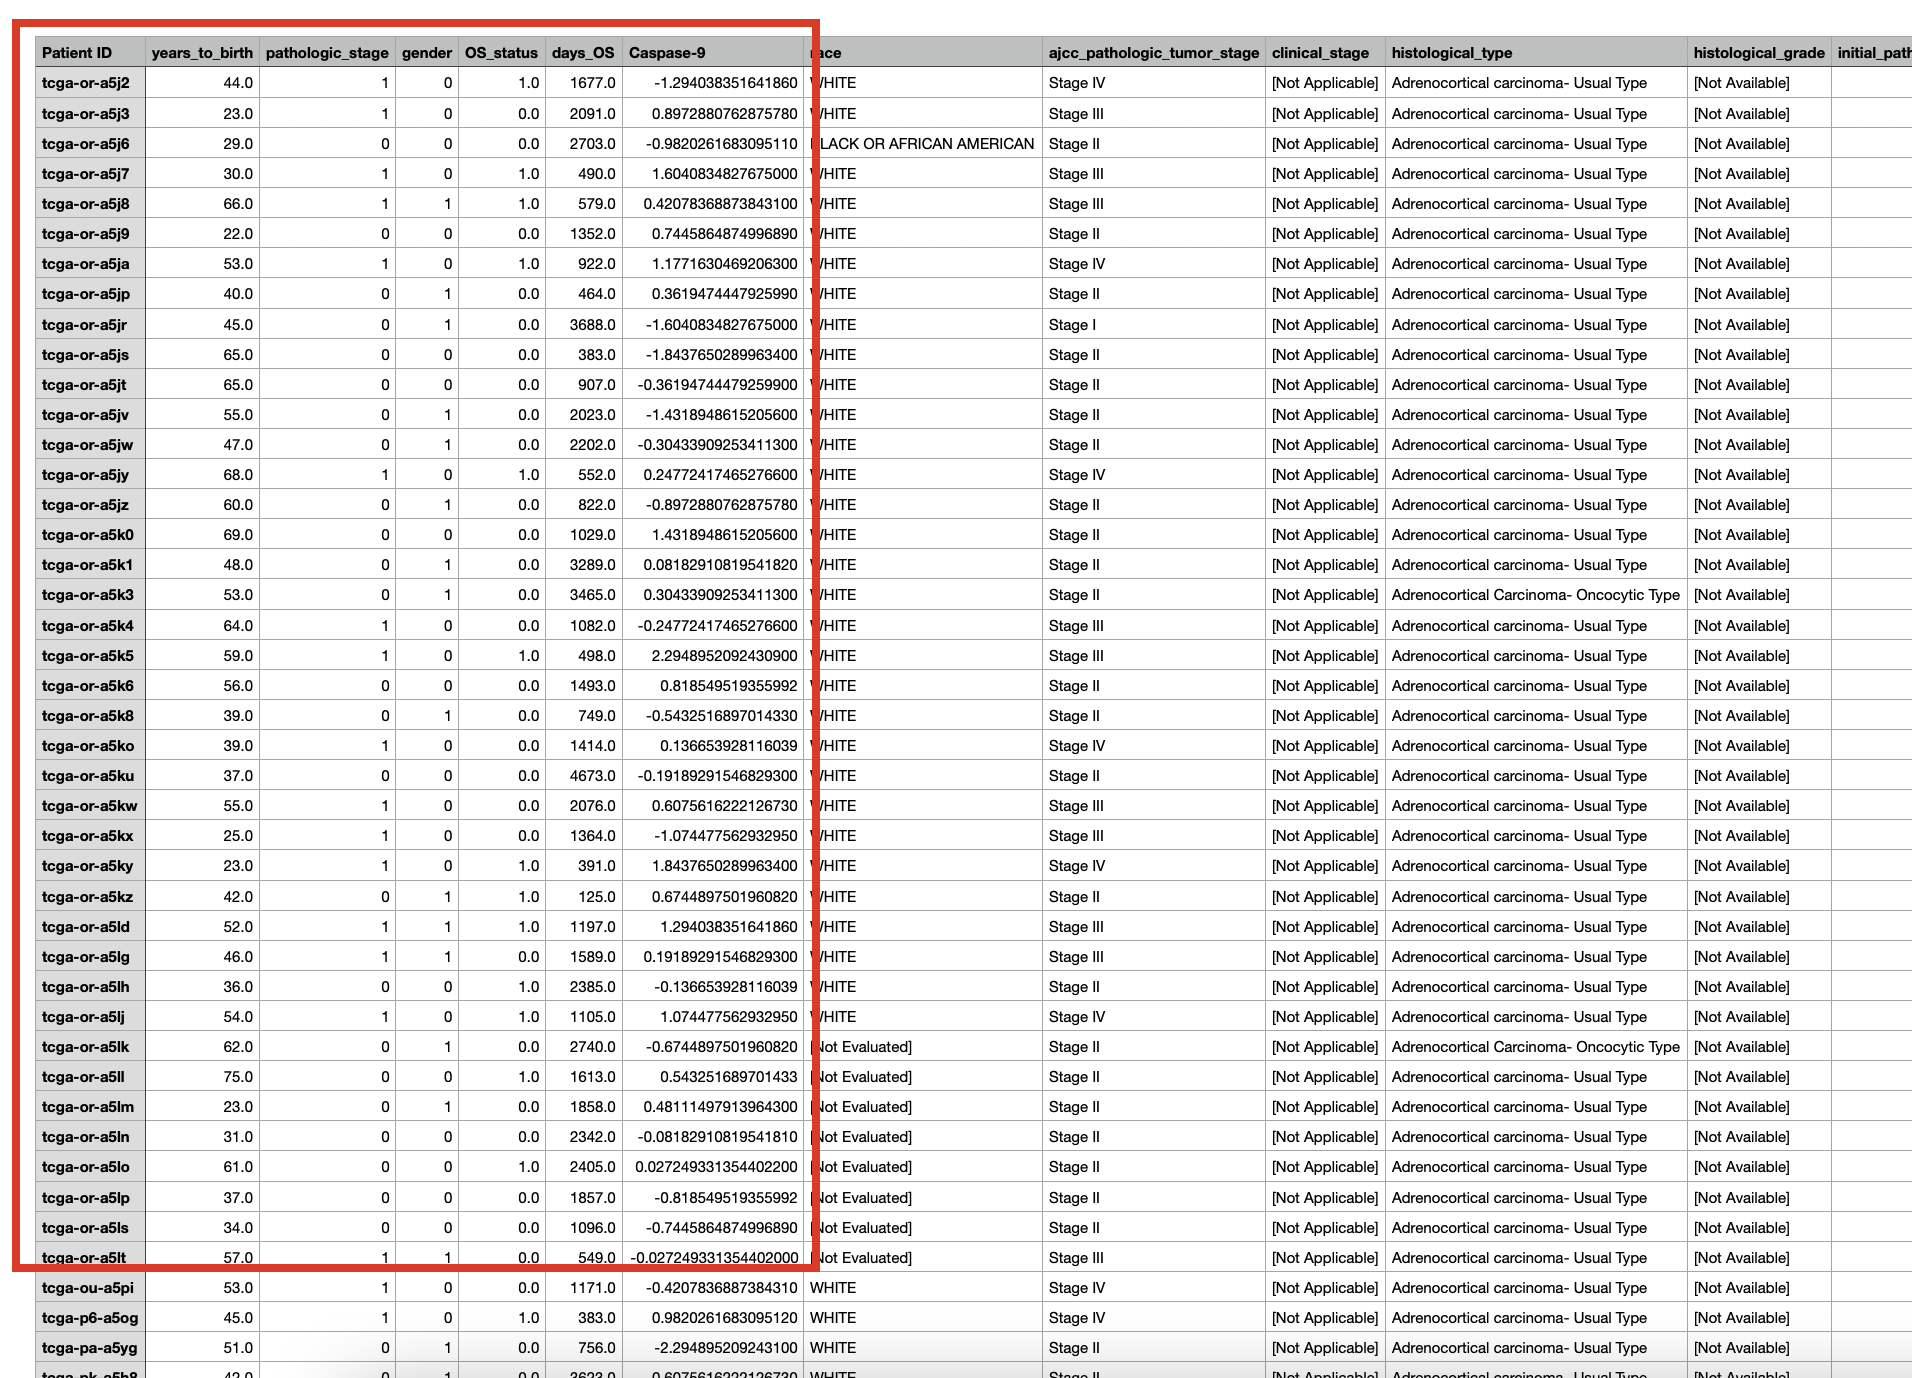 The Kaplan-Meier plot and forest plot in the survival analysis can be downloaded as PDF with customized height and width (red boxes).  |
|
Overview of DoSurvive
Browse Database Explore Combined Effects Analyze your data Statistics Analysis About |
DoSurvival is a webserver and a database for survival analysis, DoSurvive provides three
survival analysis method: the
log-rank test
, the
cox proportioanl hazard model
and the
accelerated failure-time model
; and four survival types: overall survival, progression-free survival,
disease-free survival and disease-specific survival. For all three methods and four survival types,
DoSurvive offers five different quantiative features, namely expression level of protein, mRNA,
miRNA, lncRNA and the methylation levels of CpG sites, for up to 33 cancer types in TCGA.
With DoSurvive, users can:
|